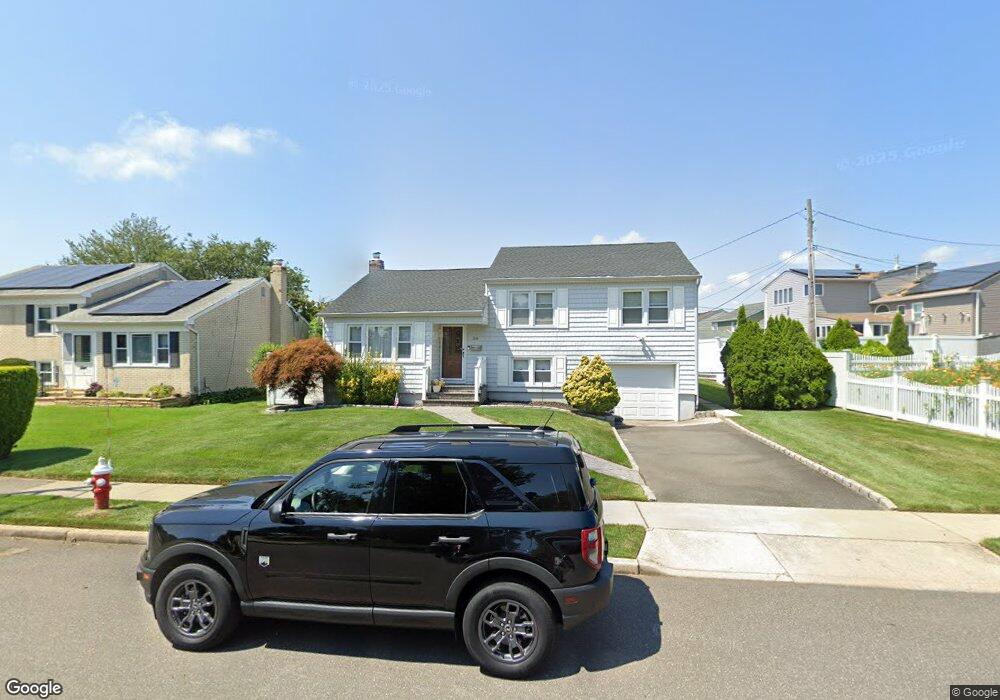
28 Romscho St Bethpage, NY 11714
Estimated Value: $784,057 - $859,000
3
Beds
3
Baths
1,414
Sq Ft
$581/Sq Ft
Est. Value
About This Home
This home is located at 28 Romscho St, Bethpage, NY 11714 and is currently estimated at $821,529, approximately $580 per square foot. 28 Romscho St is a home located in Nassau County with nearby schools including Central Boulevard Elementary School, John F Kennedy Middle School, and Bethpage Senior High School.
Ownership History
Date
Name
Owned For
Owner Type
Purchase Details
Closed on
Sep 9, 2014
Sold by
Lubelsky Elaine and Lubelsky Martin
Bought by
Sasloff Anastasiya and Thomas Joseph
Current Estimated Value
Home Financials for this Owner
Home Financials are based on the most recent Mortgage that was taken out on this home.
Original Mortgage
$384,000
Outstanding Balance
$293,760
Interest Rate
4.12%
Mortgage Type
Purchase Money Mortgage
Estimated Equity
$527,769
Create a Home Valuation Report for This Property
The Home Valuation Report is an in-depth analysis detailing your home's value as well as a comparison with similar homes in the area
Home Values in the Area
Average Home Value in this Area
Purchase History
| Date | Buyer | Sale Price | Title Company |
|---|---|---|---|
| Sasloff Anastasiya | $480,000 | The Judicial Title |
Source: Public Records
Mortgage History
| Date | Status | Borrower | Loan Amount |
|---|---|---|---|
| Open | Sasloff Anastasiya | $384,000 |
Source: Public Records
Tax History Compared to Growth
Tax History
| Year | Tax Paid | Tax Assessment Tax Assessment Total Assessment is a certain percentage of the fair market value that is determined by local assessors to be the total taxable value of land and additions on the property. | Land | Improvement |
|---|---|---|---|---|
| 2025 | $12,099 | $465 | $204 | $261 |
| 2024 | $4,680 | $501 | $220 | $281 |
| 2023 | $11,651 | $515 | $226 | $289 |
| 2022 | $11,651 | $522 | $229 | $293 |
| 2021 | $11,517 | $565 | $248 | $317 |
| 2020 | $13,036 | $755 | $513 | $242 |
| 2019 | $12,170 | $755 | $513 | $242 |
| 2018 | $11,111 | $755 | $0 | $0 |
| 2017 | $5,879 | $755 | $513 | $242 |
| 2016 | $9,759 | $755 | $503 | $252 |
| 2015 | -- | $755 | $503 | $252 |
| 2014 | -- | $755 | $503 | $252 |
| 2013 | $3,165 | $770 | $513 | $257 |
Source: Public Records
Map
Nearby Homes