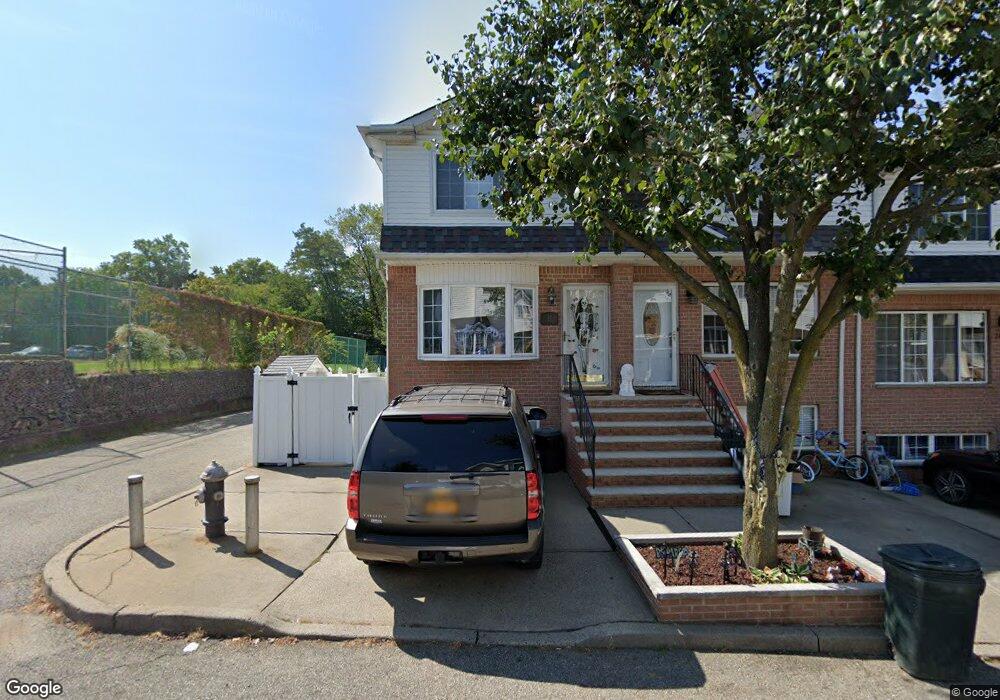
28 Rutherford Ct Staten Island, NY 10309
Rossville NeighborhoodEstimated Value: $683,000 - $726,093
3
Beds
3
Baths
1,800
Sq Ft
$392/Sq Ft
Est. Value
About This Home
This home is located at 28 Rutherford Ct, Staten Island, NY 10309 and is currently estimated at $705,023, approximately $391 per square foot. 28 Rutherford Ct is a home located in Richmond County with nearby schools including P.S. 56 - The Louis Desario School, Is 34 Tottenville, and Tottenville High School.
Ownership History
Date
Name
Owned For
Owner Type
Purchase Details
Closed on
Feb 20, 2009
Sold by
Fidanza Michael and Fidanza Rosalie
Bought by
Parisi Ralph A and Parisi Donna
Current Estimated Value
Home Financials for this Owner
Home Financials are based on the most recent Mortgage that was taken out on this home.
Original Mortgage
$334,800
Outstanding Balance
$212,087
Interest Rate
5.14%
Mortgage Type
Purchase Money Mortgage
Estimated Equity
$492,936
Purchase Details
Closed on
Jun 6, 2001
Sold by
Decaro Gerlando and Decaro Arlene
Bought by
Fidanza Michael A and Fidanza Rosalie
Home Financials for this Owner
Home Financials are based on the most recent Mortgage that was taken out on this home.
Original Mortgage
$181,600
Interest Rate
6.91%
Purchase Details
Closed on
Feb 2, 1998
Sold by
Barry Street Corp
Bought by
Decaro Gerlando and Decaro Arlene
Home Financials for this Owner
Home Financials are based on the most recent Mortgage that was taken out on this home.
Original Mortgage
$106,805
Interest Rate
6.85%
Create a Home Valuation Report for This Property
The Home Valuation Report is an in-depth analysis detailing your home's value as well as a comparison with similar homes in the area
Home Values in the Area
Average Home Value in this Area
Purchase History
| Date | Buyer | Sale Price | Title Company |
|---|---|---|---|
| Parisi Ralph A | $372,000 | None Available | |
| Fidanza Michael A | $227,000 | Stewart Title | |
| Decaro Gerlando | $114,000 | Ticor Title Guarantee Compan |
Source: Public Records
Mortgage History
| Date | Status | Borrower | Loan Amount |
|---|---|---|---|
| Open | Parisi Ralph A | $334,800 | |
| Previous Owner | Fidanza Michael A | $181,600 | |
| Previous Owner | Decaro Gerlando | $106,805 |
Source: Public Records
Tax History Compared to Growth
Tax History
| Year | Tax Paid | Tax Assessment Tax Assessment Total Assessment is a certain percentage of the fair market value that is determined by local assessors to be the total taxable value of land and additions on the property. | Land | Improvement |
|---|---|---|---|---|
| 2025 | $6,070 | $42,540 | $5,315 | $37,225 |
| 2024 | $6,070 | $36,120 | $5,924 | $30,196 |
| 2023 | $5,791 | $28,512 | $5,232 | $23,280 |
| 2022 | $5,631 | $31,380 | $7,080 | $24,300 |
| 2021 | $5,600 | $33,060 | $7,080 | $25,980 |
| 2020 | $5,633 | $30,180 | $7,080 | $23,100 |
| 2019 | $5,268 | $28,980 | $7,080 | $21,900 |
| 2018 | $4,843 | $23,760 | $7,080 | $16,680 |
| 2017 | $4,791 | $23,505 | $6,848 | $16,657 |
| 2016 | $4,433 | $22,176 | $6,658 | $15,518 |
| 2015 | $4,030 | $22,176 | $5,516 | $16,660 |
| 2014 | $4,030 | $21,000 | $5,880 | $15,120 |
Source: Public Records
Map
Nearby Homes
- 40 Bower Ct
- 38 Cypress Loop
- 97 Bower Ct Unit 1
- 97 Bower Ct Unit 74
- 22 Charleston Ave Unit 168
- 62 Arrowood Ct Unit 601
- 27 Berry Ct Unit 565
- 37 Charleston Ave
- 60 Pond St
- 85 Cypress Loop
- 87 Cypress Loop Unit 243
- 28 Berry Ct Unit 576
- 24 Berry Ct Unit 574
- 39 Hemlock Ct Unit 152
- 5 Wirt Ave
- 98 Alverson Ave
- 76 Lucille Ave
- 53 Morris St
- 39 Selkirk St
- 22 Alverson Ave
- 26 Rutherford Ct
- 24 Rutherford Ct
- 20 Rutherford Streeet
- 22 Rutherford Ct
- 20 Rutherford Ct
- 29 Schindler Ct
- 27 Schindler Ct
- 18 Rutherford Ct
- 25 Schindler Ct
- 23 Schindler Ct
- 21 Schindler Ct
- 16 Rutherford Ct
- 19 Schindler Ct
- 27 Rutherford Ct
- 25 Rutherford Ct
- 17 Schindler Ct
- 29 Rutherford Ct
- 23 Rutherford Ct
- 23 Rutherford Ct Unit 23 Rutherford Court
- 21 Rutherford Ct