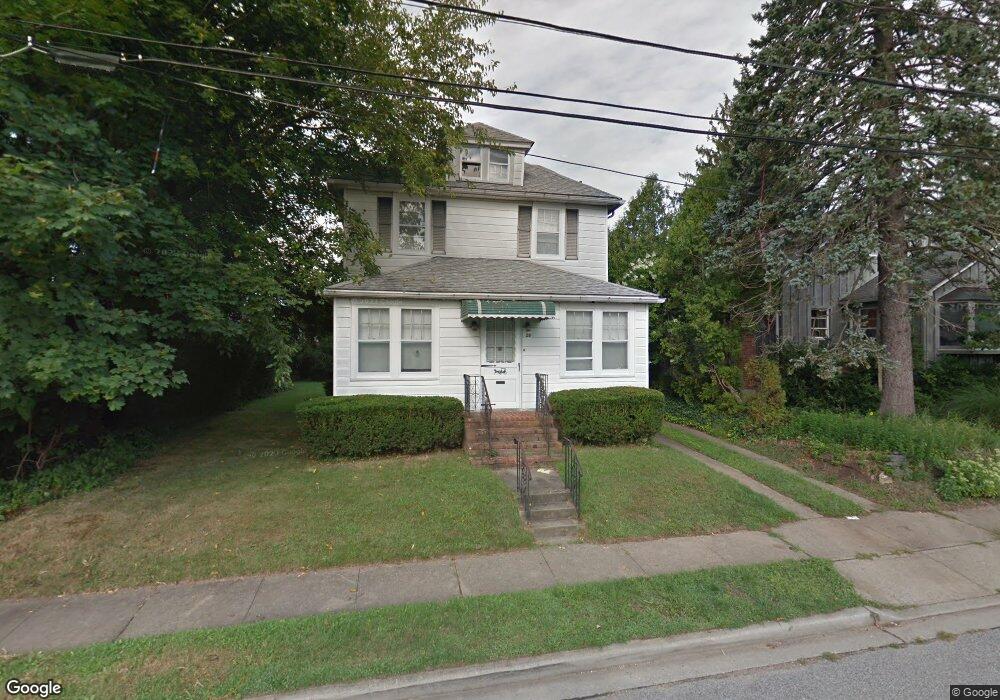
28 S 4th St Locust Valley, NY 11560
Estimated Value: $775,000 - $813,168
--
Bed
2
Baths
1,636
Sq Ft
$485/Sq Ft
Est. Value
About This Home
This home is located at 28 S 4th St, Locust Valley, NY 11560 and is currently estimated at $794,084, approximately $485 per square foot. 28 S 4th St is a home located in Nassau County with nearby schools including Locust Valley High School, Friends Academy, and Portledge School.
Ownership History
Date
Name
Owned For
Owner Type
Purchase Details
Closed on
May 23, 2024
Sold by
Rooster13 Llc
Bought by
Gillespie Matthew and Gillespie Allison
Current Estimated Value
Home Financials for this Owner
Home Financials are based on the most recent Mortgage that was taken out on this home.
Original Mortgage
$661,500
Outstanding Balance
$652,606
Interest Rate
7.1%
Mortgage Type
New Conventional
Estimated Equity
$141,478
Purchase Details
Closed on
Mar 13, 2014
Sold by
Rooster13 Llc and Parisi & Leonick Llp
Bought by
Rooster13 Llc
Purchase Details
Closed on
Jul 8, 2013
Sold by
Mazzeo Ralph K
Bought by
Rooster Llc
Purchase Details
Closed on
Jul 27, 2011
Sold by
Mazzeo Ralph K and Of Angelina Mazzeo
Bought by
Of Angelina Mazzeo
Purchase Details
Closed on
Nov 7, 2000
Create a Home Valuation Report for This Property
The Home Valuation Report is an in-depth analysis detailing your home's value as well as a comparison with similar homes in the area
Home Values in the Area
Average Home Value in this Area
Purchase History
| Date | Buyer | Sale Price | Title Company |
|---|---|---|---|
| Gillespie Matthew | $945,000 | None Available | |
| Gillespie Matthew | $945,000 | None Available | |
| Rooster13 Llc | $250,000 | -- | |
| Rooster13 Llc | $250,000 | -- | |
| Rooster Llc | $500,000 | -- | |
| Rooster Llc | $500,000 | -- | |
| Of Angelina Mazzeo | -- | -- | |
| Of Angelina Mazzeo | -- | -- | |
| -- | -- | -- | |
| -- | -- | -- |
Source: Public Records
Mortgage History
| Date | Status | Borrower | Loan Amount |
|---|---|---|---|
| Open | Gillespie Matthew | $661,500 | |
| Closed | Gillespie Matthew | $661,500 |
Source: Public Records
Tax History Compared to Growth
Tax History
| Year | Tax Paid | Tax Assessment Tax Assessment Total Assessment is a certain percentage of the fair market value that is determined by local assessors to be the total taxable value of land and additions on the property. | Land | Improvement |
|---|---|---|---|---|
| 2025 | $12,925 | $524 | $225 | $299 |
| 2024 | $4,545 | $524 | $225 | $299 |
| 2023 | $12,157 | $519 | $244 | $275 |
| 2022 | $12,157 | $524 | $225 | $299 |
| 2021 | $12,831 | $521 | $223 | $298 |
| 2020 | $13,087 | $914 | $677 | $237 |
| 2019 | $12,861 | $914 | $677 | $237 |
| 2018 | $12,092 | $828 | $0 | $0 |
| 2017 | $6,745 | $900 | $716 | $184 |
| 2016 | $10,814 | $900 | $716 | $184 |
| 2015 | $3,838 | $954 | $759 | $195 |
| 2014 | $3,838 | $954 | $759 | $195 |
| 2013 | $3,504 | $954 | $759 | $195 |
Source: Public Records
Map
Nearby Homes