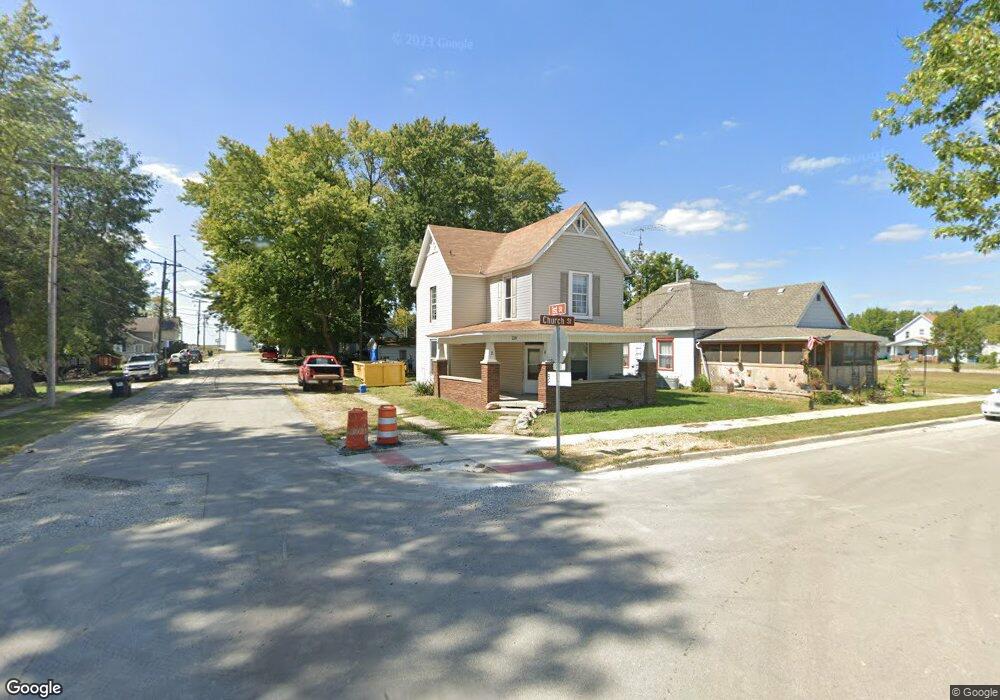
28 S Chruch St Otterbein, IN 47970
Estimated Value: $189,344 - $291,000
3
Beds
3
Baths
1,888
Sq Ft
$137/Sq Ft
Est. Value
About This Home
This home is located at 28 S Chruch St, Otterbein, IN 47970 and is currently estimated at $259,336, approximately $137 per square foot. 28 S Chruch St is a home located in Benton County with nearby schools including Benton Central Junior/Senior High School.
Ownership History
Date
Name
Owned For
Owner Type
Purchase Details
Closed on
May 29, 2025
Sold by
Choe Young
Bought by
Ragland Jonathin J and Nethercutt Emily I
Current Estimated Value
Home Financials for this Owner
Home Financials are based on the most recent Mortgage that was taken out on this home.
Original Mortgage
$274,928
Outstanding Balance
$274,215
Interest Rate
6.76%
Mortgage Type
FHA
Estimated Equity
-$14,879
Purchase Details
Closed on
Jul 24, 2023
Sold by
Cole Harry A
Bought by
Choe Young
Purchase Details
Closed on
Dec 29, 2015
Sold by
Acp 1 Llc Acp 1 Llc
Bought by
Cole Harry A
Purchase Details
Closed on
Sep 2, 1997
Sold by
Not Provided
Bought by
Not Provided
Purchase Details
Closed on
Jan 23, 1997
Sold by
Not Provided
Bought by
Not Provided
Create a Home Valuation Report for This Property
The Home Valuation Report is an in-depth analysis detailing your home's value as well as a comparison with similar homes in the area
Home Values in the Area
Average Home Value in this Area
Purchase History
| Date | Buyer | Sale Price | Title Company |
|---|---|---|---|
| Ragland Jonathin J | -- | Metropolitan Title | |
| Choe Young | $42,000 | None Listed On Document | |
| Cole Harry A | $10,000 | -- | |
| Not Provided | $57,000 | -- | |
| Not Provided | $45,000 | -- |
Source: Public Records
Mortgage History
| Date | Status | Borrower | Loan Amount |
|---|---|---|---|
| Open | Ragland Jonathin J | $274,928 |
Source: Public Records
Tax History Compared to Growth
Tax History
| Year | Tax Paid | Tax Assessment Tax Assessment Total Assessment is a certain percentage of the fair market value that is determined by local assessors to be the total taxable value of land and additions on the property. | Land | Improvement |
|---|---|---|---|---|
| 2024 | $2,192 | $97,000 | $8,400 | $88,600 |
| 2023 | $3,384 | $147,700 | $7,700 | $140,000 |
| 2022 | $3,144 | $136,100 | $7,700 | $128,400 |
| 2021 | $2,788 | $120,700 | $7,700 | $113,000 |
| 2020 | $2,088 | $97,100 | $7,700 | $89,400 |
| 2019 | $1,852 | $92,600 | $7,400 | $85,200 |
| 2018 | $1,626 | $81,300 | $7,400 | $73,900 |
| 2017 | $1,474 | $73,700 | $7,400 | $66,300 |
| 2016 | $994 | $48,500 | $7,400 | $41,100 |
| 2014 | $1,058 | $52,900 | $9,500 | $43,400 |
| 2013 | $1,058 | $47,800 | $8,700 | $39,100 |
Source: Public Records
Map
Nearby Homes
- 505 W Darby Dr
- 107 E 4th St
- 305 N Maddox Rd
- 402 E Oxford St
- 513 S Kerkhoff Ave
- 10240 E 975 N Unit 35
- 10240 E 975 N Unit 31
- 10240 E 975 N Unit 20
- 10240 E 975 N Unit 23
- 10240 E 975 N Unit 30
- 10240 E 975 N Unit 21
- 10240 E 975 N Unit 37
- 10240 E 975 N Unit 34
- 10240 E 975 N Unit 38
- 10240 E 975 N Unit 36
- 10872 N 875 E
- 7220 W 350 N
- 6509 Pin Oaks Dr
- 3728 Gear St
- 3823 Walnut St