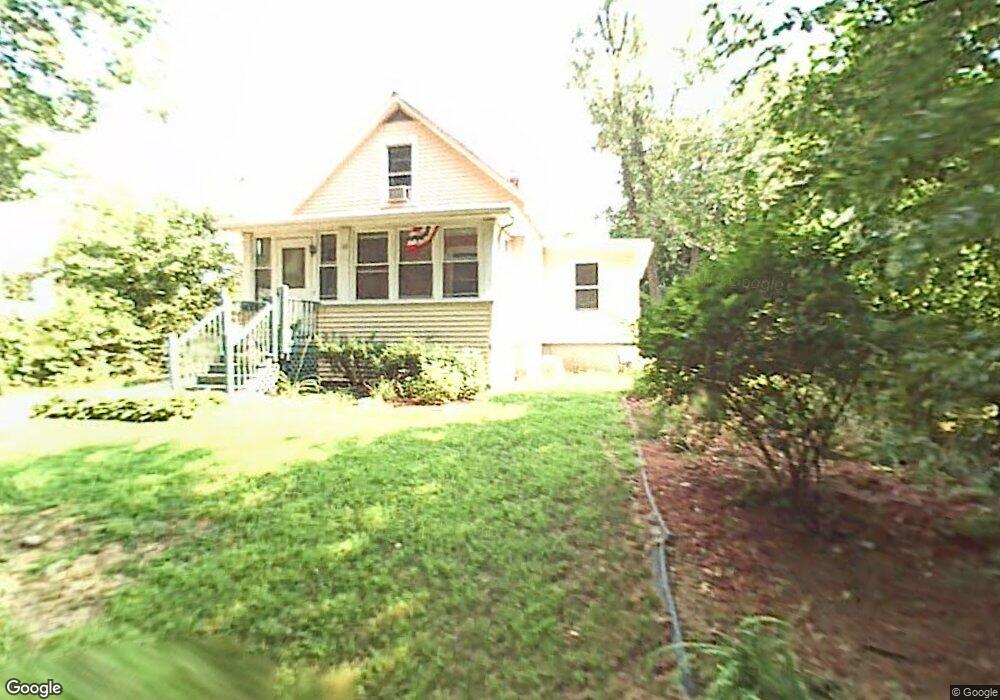
28 Saint Anthony St Worcester, MA 01607
Broadmeadow Brook NeighborhoodEstimated Value: $315,000 - $362,474
3
Beds
1
Bath
1,032
Sq Ft
$333/Sq Ft
Est. Value
About This Home
This home is located at 28 Saint Anthony St, Worcester, MA 01607 and is currently estimated at $344,119, approximately $333 per square foot. 28 Saint Anthony St is a home located in Worcester County with nearby schools including Quinsigamond School, Jacob Hiatt Magnet School, and Chandler Magnet.
Ownership History
Date
Name
Owned For
Owner Type
Purchase Details
Closed on
Nov 29, 2011
Sold by
Landry Allen A and Valley-Landry Gail F
Bought by
Landry Lt and Landry Allen A
Current Estimated Value
Purchase Details
Closed on
Apr 29, 1987
Sold by
Handley Robert E
Bought by
Landry Allen A
Home Financials for this Owner
Home Financials are based on the most recent Mortgage that was taken out on this home.
Original Mortgage
$74,900
Interest Rate
8.99%
Mortgage Type
Purchase Money Mortgage
Create a Home Valuation Report for This Property
The Home Valuation Report is an in-depth analysis detailing your home's value as well as a comparison with similar homes in the area
Home Values in the Area
Average Home Value in this Area
Purchase History
| Date | Buyer | Sale Price | Title Company |
|---|---|---|---|
| Landry Lt | -- | -- | |
| Landry Allen A | $88,900 | -- |
Source: Public Records
Mortgage History
| Date | Status | Borrower | Loan Amount |
|---|---|---|---|
| Previous Owner | Landry Allen A | $74,900 |
Source: Public Records
Tax History Compared to Growth
Tax History
| Year | Tax Paid | Tax Assessment Tax Assessment Total Assessment is a certain percentage of the fair market value that is determined by local assessors to be the total taxable value of land and additions on the property. | Land | Improvement |
|---|---|---|---|---|
| 2025 | $4,073 | $308,800 | $97,900 | $210,900 |
| 2024 | $3,982 | $289,600 | $97,900 | $191,700 |
| 2023 | $3,824 | $266,700 | $85,100 | $181,600 |
| 2022 | $3,489 | $229,400 | $68,100 | $161,300 |
| 2021 | $3,297 | $202,500 | $54,500 | $148,000 |
| 2020 | $3,227 | $189,800 | $54,500 | $135,300 |
| 2019 | $3,042 | $169,000 | $49,000 | $120,000 |
| 2018 | $3,026 | $160,000 | $49,000 | $111,000 |
| 2017 | $2,893 | $150,500 | $49,000 | $101,500 |
| 2016 | $2,871 | $139,300 | $36,400 | $102,900 |
| 2015 | $2,796 | $139,300 | $36,400 | $102,900 |
| 2014 | $2,722 | $139,300 | $36,400 | $102,900 |
Source: Public Records
Map
Nearby Homes
- 405 Granite St
- 10 Gensell Ave
- 422 Granite St
- 103 Blackstone River Rd
- 1295 Millbury St Unit B
- 78 Greenwood St
- 4 Crest Ave
- 11 Gibbs St Unit 12
- 29 Steele St
- 55 Whipple St
- 17 Thenius St
- 10 Steele St
- 145 Loxwood St
- 55 Tennyson St
- 28 Bittersweet Blvd
- 557 SW Cutoff Unit 79
- 557 SW Cutoff Unit 107
- 557 SW Cutoff Unit 17
- 7 Lorraine Rd
- 15 Clearview Terrace Unit 68
- 34 Saint Anthony St
- 8 Saint Anthony St
- 25 Winnipeg St
- 110 Saint Louis St
- 17 Winnipeg St
- 102 Saint Louis St
- 14 Saint Anthony St
- 9 Winnipeg St
- 38 Saint Anthony St
- 38 Saint Anthony St Unit 38
- 111 Saint Louis St
- 12 Saint Anthony St
- 12-14 St Anthony St
- 39 Saint Anthony St
- 100 Saint Louis St
- 115 Saint Louis St
- 22 Winnipeg St
- 32 Winnipeg St
- 16 Winnipeg St
- 1117 Millbury St