Estimated Value: $257,947 - $291,000
4
Beds
3
Baths
1,284
Sq Ft
$214/Sq Ft
Est. Value
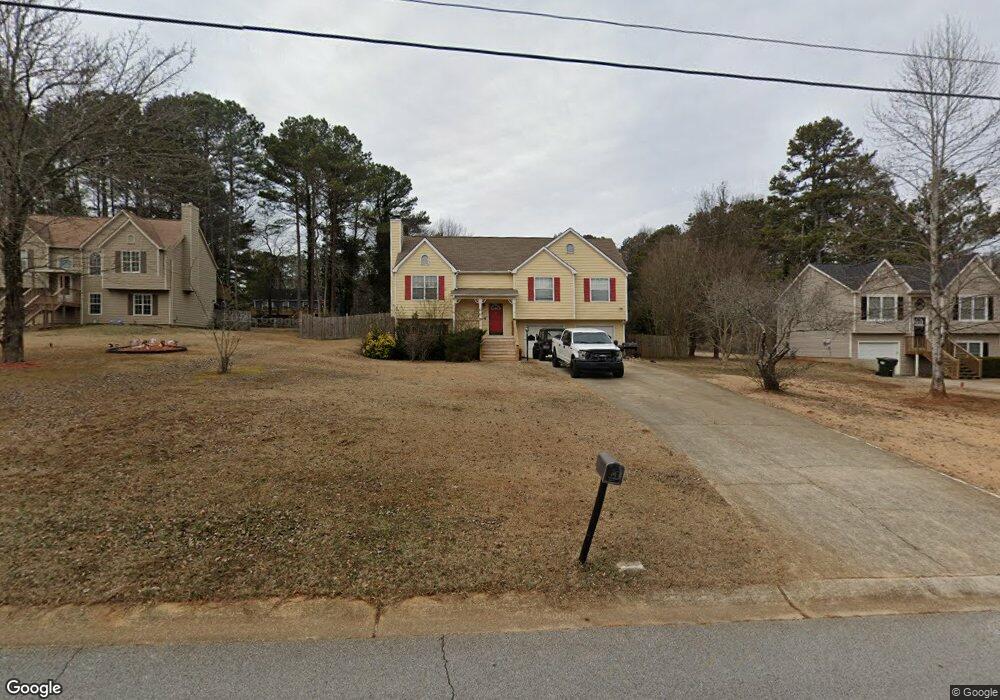
About This Home
This home is located at 28 Settlers Mill Run, Hiram, GA 30141 and is currently estimated at $274,987, approximately $214 per square foot. 28 Settlers Mill Run is a home located in Paulding County with nearby schools including Sam D. Panter Elementary School, J. A. Dobbins Middle School, and Paulding County High School.
Ownership History
Date
Name
Owned For
Owner Type
Purchase Details
Closed on
Jul 10, 2020
Sold by
Rogers Gayle A
Bought by
Terry Chase L
Current Estimated Value
Home Financials for this Owner
Home Financials are based on the most recent Mortgage that was taken out on this home.
Original Mortgage
$146,000
Outstanding Balance
$129,703
Interest Rate
3.2%
Mortgage Type
New Conventional
Estimated Equity
$145,284
Create a Home Valuation Report for This Property
The Home Valuation Report is an in-depth analysis detailing your home's value as well as a comparison with similar homes in the area
Home Values in the Area
Average Home Value in this Area
Purchase History
| Date | Buyer | Sale Price | Title Company |
|---|---|---|---|
| Terry Chase L | $156,000 | -- |
Source: Public Records
Mortgage History
| Date | Status | Borrower | Loan Amount |
|---|---|---|---|
| Open | Terry Chase L | $146,000 |
Source: Public Records
Tax History Compared to Growth
Tax History
| Year | Tax Paid | Tax Assessment Tax Assessment Total Assessment is a certain percentage of the fair market value that is determined by local assessors to be the total taxable value of land and additions on the property. | Land | Improvement |
|---|---|---|---|---|
| 2024 | $2,544 | $102,252 | $12,000 | $90,252 |
| 2023 | $2,683 | $102,912 | $12,000 | $90,912 |
| 2022 | $2,377 | $91,168 | $12,000 | $79,168 |
| 2021 | $1,813 | $64,816 | $8,000 | $56,816 |
| 2020 | $630 | $59,104 | $8,000 | $51,104 |
| 2019 | $615 | $55,620 | $8,000 | $47,620 |
| 2018 | $566 | $51,984 | $8,000 | $43,984 |
| 2017 | $526 | $46,720 | $8,000 | $38,720 |
| 2016 | $491 | $44,896 | $8,000 | $36,896 |
| 2015 | $384 | $34,032 | $8,000 | $26,032 |
| 2014 | $405 | $33,812 | $8,000 | $25,812 |
| 2013 | -- | $20,000 | $8,000 | $12,000 |
Source: Public Records
Map
Nearby Homes
- 142 Wellspring Point
- 14 Woodmill Ct Unit 2
- 237 Settlers Mill Run
- 520 White Pines Dr
- 51 Old Teal Rd
- 164 Emerald Pines Ln
- 426 Old Sudie Rd
- 122 Prince Way
- 149 Barrington Ln
- 237 White Pines Dr
- 242 Barrington Dr
- 1707 Hiram Sudie Rd
- 144 Parson Rd
- 1019 Davis Mill Rd S
- 00 Villa Rica Highway 61
- 3371 Villa Rica Hwy
- 00 Scoggins Rd
- 494 Campground School Rd
- 50 Settlers Mill Run
- 16 Settlers Mill Run
- 178 Wellspring Point
- 64 Settlers Mill Run
- 25 Settlers Mill Run
- 154 Wellspring Point
- 57 Settlers Mill Run
- 186 Wellspring Point
- 96 Settlers Mill Run
- 48 Buhrstone Crossing
- 689 Hiram Way
- 85 Settlers Mill Run
- 1180 Hiram Sudie Rd
- 120 Wellspring Point
- 185 Wellspring Point
- 0 Settlers Mill Run Unit 7005906
- 0 Settlers Mill Run Unit 8983196
- 0 Settlers Mill Run Unit 9046117
- 0 Settlers Mill Run Unit 8761389
- 0 Settlers Mill Run Unit 7182403