Estimated Value: $74,000 - $149,000
Studio
--
Bath
1,310
Sq Ft
$84/Sq Ft
Est. Value
About This Home
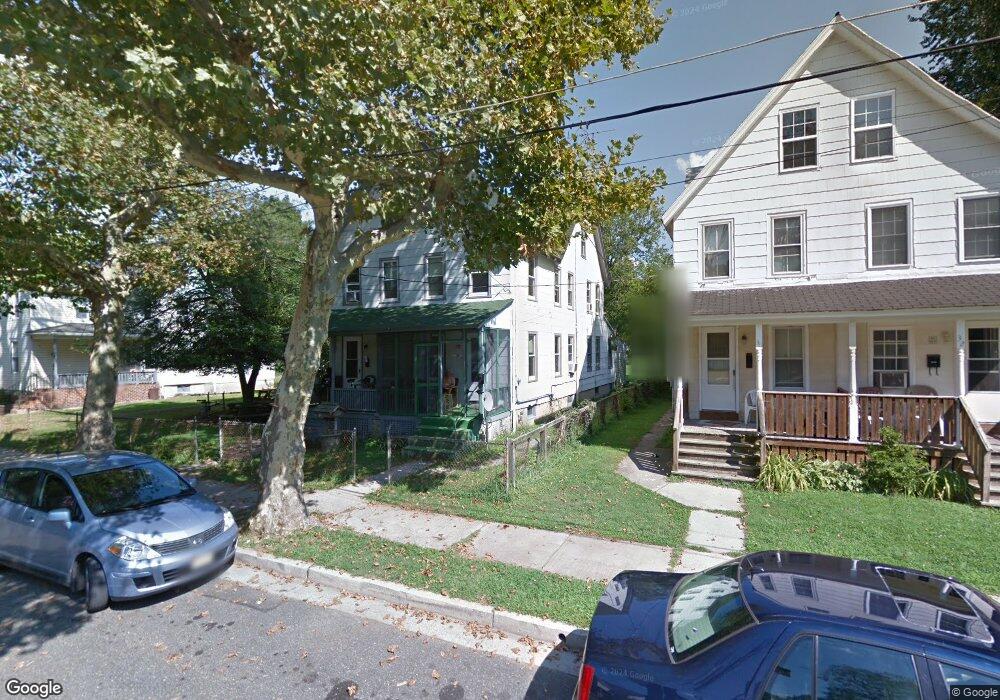
This home is located at 28 Seventh St, Salem, NJ 08079 and is currently estimated at $110,259, approximately $84 per square foot. 28 Seventh St is a home located in Salem County with nearby schools including John Fenwick Elementary School, Salem Middle School, and Salem High School.
Ownership History
Date
Name
Owned For
Owner Type
Purchase Details
Closed on
Feb 24, 2026
Sold by
Flip Or Keep It Real Estate Llc
Bought by
Delaware Valley Opportunity Fund Llc
Current Estimated Value
Home Financials for this Owner
Home Financials are based on the most recent Mortgage that was taken out on this home.
Original Mortgage
$102,300
Outstanding Balance
$102,198
Interest Rate
6.01%
Mortgage Type
Construction
Estimated Equity
$8,061
Purchase Details
Closed on
Sep 8, 2005
Sold by
Mcgahn Laurie Ann and Hewitt Robert S
Bought by
Fuse William G and Fuse Claudia D
Create a Home Valuation Report for This Property
The Home Valuation Report is an in-depth analysis detailing your home's value as well as a comparison with similar homes in the area
Home Values in the Area
Average Home Value in this Area
Purchase History
| Date | Buyer | Sale Price | Title Company |
|---|---|---|---|
| Delaware Valley Opportunity Fund Llc | $60,000 | American Land Title | |
| Fuse William G | $25,000 | Salem Oak Title Agency Inc |
Source: Public Records
Mortgage History
| Date | Status | Borrower | Loan Amount |
|---|---|---|---|
| Open | Delaware Valley Opportunity Fund Llc | $102,300 |
Source: Public Records
Tax History
| Year | Tax Paid | Tax Assessment Tax Assessment Total Assessment is a certain percentage of the fair market value that is determined by local assessors to be the total taxable value of land and additions on the property. | Land | Improvement |
|---|---|---|---|---|
| 2025 | $2,335 | $28,400 | $7,300 | $21,100 |
| 2024 | $2,233 | $28,400 | $7,300 | $21,100 |
| 2023 | $2,233 | $28,400 | $7,300 | $21,100 |
| 2022 | $2,135 | $28,400 | $7,300 | $21,100 |
| 2021 | $1,561 | $28,400 | $7,300 | $21,100 |
| 2020 | $2,020 | $28,400 | $7,300 | $21,100 |
| 2019 | $2,008 | $28,400 | $7,300 | $21,100 |
| 2018 | $1,964 | $28,400 | $7,300 | $21,100 |
| 2017 | $1,940 | $28,400 | $7,300 | $21,100 |
| 2016 | $1,566 | $40,000 | $14,000 | $26,000 |
| 2015 | $2,467 | $63,800 | $14,000 | $49,800 |
| 2014 | $2,454 | $63,800 | $14,000 | $49,800 |
Source: Public Records
Map
Nearby Homes
Your Personal Tour Guide
Ask me questions while you tour the home.