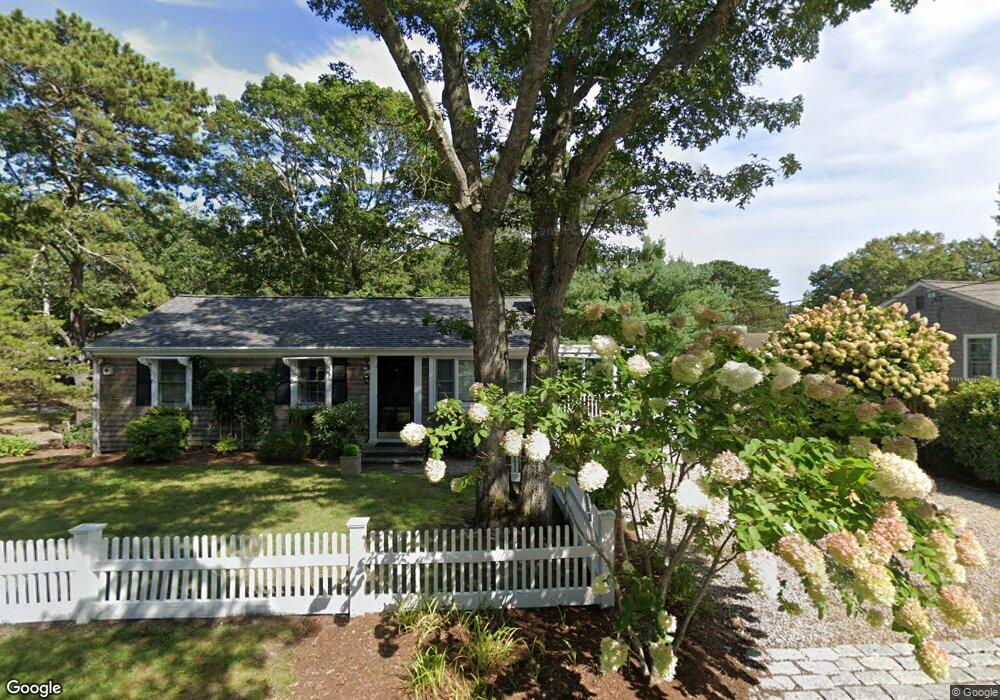
28 Signe Rd Dennis, MA 02638
Dennis Village NeighborhoodEstimated Value: $549,000 - $647,000
3
Beds
1
Bath
800
Sq Ft
$756/Sq Ft
Est. Value
About This Home
This home is located at 28 Signe Rd, Dennis, MA 02638 and is currently estimated at $604,812, approximately $756 per square foot. 28 Signe Rd is a home located in Barnstable County with nearby schools including Dennis-Yarmouth Regional High School.
Ownership History
Date
Name
Owned For
Owner Type
Purchase Details
Closed on
Apr 29, 2004
Sold by
Delima Erlaine S and Demoraes Ricardo H
Bought by
Mcgarvey Lynn and Mcgarvey Peter F
Current Estimated Value
Home Financials for this Owner
Home Financials are based on the most recent Mortgage that was taken out on this home.
Original Mortgage
$200,000
Outstanding Balance
$92,144
Interest Rate
5.36%
Mortgage Type
Purchase Money Mortgage
Estimated Equity
$512,668
Purchase Details
Closed on
Dec 28, 2001
Sold by
Chicoine Ellen P and Chicoine Joseph N
Bought by
Demoraes Ricardo H and Delima Erlaine S
Home Financials for this Owner
Home Financials are based on the most recent Mortgage that was taken out on this home.
Original Mortgage
$161,466
Interest Rate
6.61%
Mortgage Type
Purchase Money Mortgage
Purchase Details
Closed on
Sep 7, 2000
Sold by
Chicoine Paul J and Chicoine Ellen P
Bought by
Chicoine Joseph N
Create a Home Valuation Report for This Property
The Home Valuation Report is an in-depth analysis detailing your home's value as well as a comparison with similar homes in the area
Home Values in the Area
Average Home Value in this Area
Purchase History
| Date | Buyer | Sale Price | Title Company |
|---|---|---|---|
| Mcgarvey Lynn | $250,000 | -- | |
| Demoraes Ricardo H | $164,000 | -- | |
| Chicoine Joseph N | $15,000 | -- |
Source: Public Records
Mortgage History
| Date | Status | Borrower | Loan Amount |
|---|---|---|---|
| Open | Mcgarvey Lynn | $200,000 | |
| Previous Owner | Demoraes Ricardo H | $161,466 |
Source: Public Records
Tax History Compared to Growth
Tax History
| Year | Tax Paid | Tax Assessment Tax Assessment Total Assessment is a certain percentage of the fair market value that is determined by local assessors to be the total taxable value of land and additions on the property. | Land | Improvement |
|---|---|---|---|---|
| 2025 | $2,584 | $596,700 | $184,500 | $412,200 |
| 2024 | $2,422 | $551,700 | $177,500 | $374,200 |
| 2023 | $2,226 | $476,700 | $136,500 | $340,200 |
| 2022 | $2,093 | $373,700 | $123,000 | $250,700 |
| 2021 | $1,965 | $325,800 | $120,600 | $205,200 |
| 2020 | $1,953 | $320,100 | $131,500 | $188,600 |
| 2019 | $2,031 | $329,200 | $161,200 | $168,000 |
| 2018 | $1,757 | $277,200 | $122,800 | $154,400 |
| 2017 | $1,675 | $272,300 | $122,800 | $149,500 |
| 2016 | $1,634 | $250,200 | $122,800 | $127,400 |
| 2015 | $1,601 | $250,200 | $122,800 | $127,400 |
| 2014 | $1,459 | $229,700 | $102,300 | $127,400 |
Source: Public Records
Map
Nearby Homes
- 59 Main St Unit 19-2
- 59 Route 6a Unit 29-4
- 268 Main St
- 13 Covey Dr
- 6 Nimble Hill Dr
- 51 Bray Farm Rd N
- 4 Ebb Rd
- 111 Merchant Ave
- 11 Uncle Stanleys Way
- 153 Bayridge Dr
- 6 Thomas Ct
- 15 Signal Hill Dr
- 15 Captain Jud Rd
- 44 Stratford Ln
- 64 Kates Path
- 35 Crown Grant Dr
- 42 John Hall Cartway Unit 42
- 50 John Hall Cartway
- 50 John Hall Cartway Unit 50