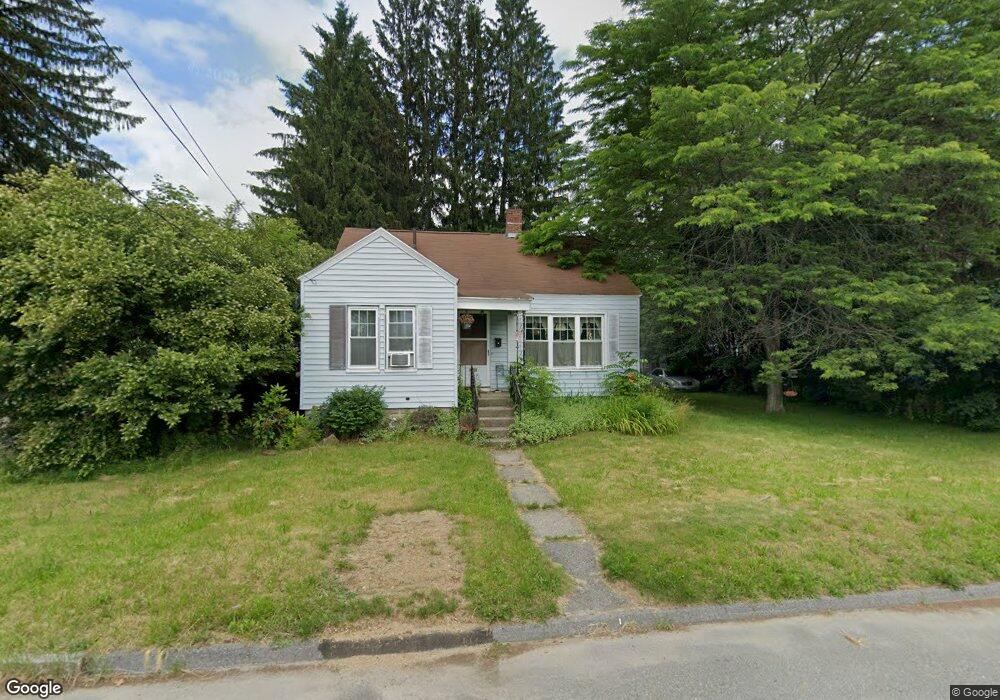
28 Southold Rd Worcester, MA 01607
South Quinsigamond Village NeighborhoodEstimated Value: $344,000 - $463,000
3
Beds
2
Baths
1,200
Sq Ft
$327/Sq Ft
Est. Value
About This Home
This home is located at 28 Southold Rd, Worcester, MA 01607 and is currently estimated at $392,184, approximately $326 per square foot. 28 Southold Rd is a home located in Worcester County with nearby schools including Quinsigamond School, Jacob Hiatt Magnet School, and Chandler Magnet.
Ownership History
Date
Name
Owned For
Owner Type
Purchase Details
Closed on
Jun 29, 2000
Sold by
Flores Herminia
Bought by
Dresser David A and Dresser Deborah R
Current Estimated Value
Home Financials for this Owner
Home Financials are based on the most recent Mortgage that was taken out on this home.
Original Mortgage
$119,900
Outstanding Balance
$43,997
Interest Rate
8.59%
Mortgage Type
Purchase Money Mortgage
Estimated Equity
$348,187
Purchase Details
Closed on
Apr 27, 1995
Sold by
Fnma
Bought by
Flores Herminia
Purchase Details
Closed on
Mar 13, 1995
Sold by
Simpson Michael
Bought by
Federal National Mortgage Association
Create a Home Valuation Report for This Property
The Home Valuation Report is an in-depth analysis detailing your home's value as well as a comparison with similar homes in the area
Home Values in the Area
Average Home Value in this Area
Purchase History
| Date | Buyer | Sale Price | Title Company |
|---|---|---|---|
| Dresser David A | $120,000 | -- | |
| Flores Herminia | $67,000 | -- | |
| Federal National Mortgage Association | $67,915 | -- |
Source: Public Records
Mortgage History
| Date | Status | Borrower | Loan Amount |
|---|---|---|---|
| Open | Federal National Mortgage Association | $119,900 | |
| Previous Owner | Federal National Mortgage Association | $95,400 | |
| Previous Owner | Federal National Mortgage Association | $32,300 |
Source: Public Records
Tax History
| Year | Tax Paid | Tax Assessment Tax Assessment Total Assessment is a certain percentage of the fair market value that is determined by local assessors to be the total taxable value of land and additions on the property. | Land | Improvement |
|---|---|---|---|---|
| 2025 | $4,134 | $313,400 | $117,700 | $195,700 |
| 2024 | $4,080 | $296,700 | $117,700 | $179,000 |
| 2023 | $3,895 | $271,600 | $102,400 | $169,200 |
| 2022 | $3,548 | $233,300 | $81,900 | $151,400 |
| 2021 | $3,313 | $203,500 | $65,500 | $138,000 |
| 2020 | $3,252 | $191,300 | $65,500 | $125,800 |
| 2019 | $3,098 | $172,100 | $58,900 | $113,200 |
| 2018 | $3,122 | $165,100 | $58,900 | $106,200 |
| 2017 | $2,996 | $155,900 | $58,900 | $97,000 |
| 2016 | $2,883 | $139,900 | $42,900 | $97,000 |
| 2015 | $2,808 | $139,900 | $42,900 | $97,000 |
| 2014 | $2,734 | $139,900 | $42,900 | $97,000 |
Source: Public Records
Map
Nearby Homes
- 29 Steele St
- 557 SW Cutoff Unit 17
- 557 SW Cutoff Unit 55
- 557 SW Cutoff Unit 60
- 22 Bittersweet Blvd
- 4 Stockholm St
- 50 Sophia Dr
- 30 Ekman St
- 6 Beckman St
- 50 Whipple St
- 73 Sophia Dr
- 154 Pakachoag St
- 457 Granite St
- 6 Epworth St
- 204-212 Hampton St
- 38 Garnet St
- 47 Gibbs St
- 464-466 Granite St
- 460-462 Granite St
- 460-466 Granite St
Your Personal Tour Guide
Ask me questions while you tour the home.