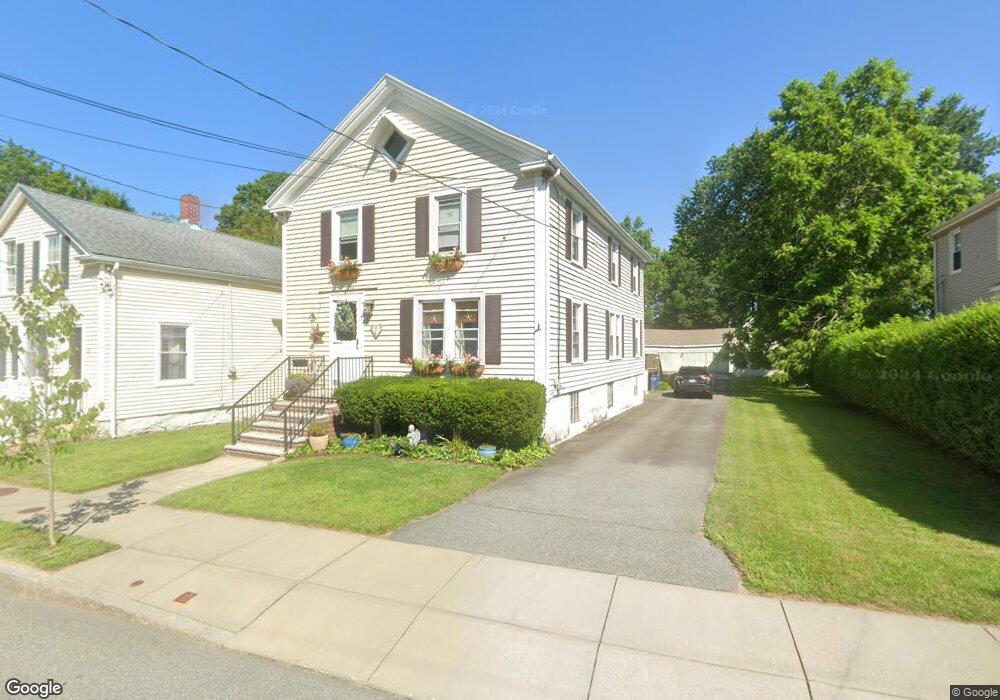
28 Spring St Fairhaven, MA 02719
Estimated Value: $559,035 - $634,000
4
Beds
2
Baths
2,560
Sq Ft
$235/Sq Ft
Est. Value
About This Home
This home is located at 28 Spring St, Fairhaven, MA 02719 and is currently estimated at $600,509, approximately $234 per square foot. 28 Spring St is a home located in Bristol County with nearby schools including Fairhaven High School, City On A Hill Charter Public School New Bedford, and St. Joseph School.
Ownership History
Date
Name
Owned For
Owner Type
Purchase Details
Closed on
Apr 30, 2002
Sold by
Rocha James M and Rocha Jeannine M
Bought by
Silva John M and Silva Karin M
Current Estimated Value
Home Financials for this Owner
Home Financials are based on the most recent Mortgage that was taken out on this home.
Original Mortgage
$179,900
Interest Rate
7.05%
Mortgage Type
Purchase Money Mortgage
Purchase Details
Closed on
Dec 20, 1996
Sold by
Marcotte Jeanne and Szala Therese
Bought by
Rocha James M and Rocha Jeannine M
Create a Home Valuation Report for This Property
The Home Valuation Report is an in-depth analysis detailing your home's value as well as a comparison with similar homes in the area
Home Values in the Area
Average Home Value in this Area
Purchase History
| Date | Buyer | Sale Price | Title Company |
|---|---|---|---|
| Silva John M | $224,900 | -- | |
| Rocha James M | $110,000 | -- |
Source: Public Records
Mortgage History
| Date | Status | Borrower | Loan Amount |
|---|---|---|---|
| Open | Rocha James M | $249,000 | |
| Closed | Rocha James M | $210,500 | |
| Closed | Rocha James M | $179,900 |
Source: Public Records
Tax History
| Year | Tax Paid | Tax Assessment Tax Assessment Total Assessment is a certain percentage of the fair market value that is determined by local assessors to be the total taxable value of land and additions on the property. | Land | Improvement |
|---|---|---|---|---|
| 2025 | $39 | $423,000 | $179,100 | $243,900 |
| 2024 | $3,854 | $417,600 | $179,100 | $238,500 |
| 2023 | $3,729 | $374,800 | $156,900 | $217,900 |
| 2022 | $3,549 | $347,300 | $145,800 | $201,500 |
| 2021 | $3,450 | $305,600 | $131,900 | $173,700 |
| 2020 | $3,380 | $305,600 | $131,900 | $173,700 |
| 2019 | $3,203 | $274,500 | $109,400 | $165,100 |
| 2018 | $3,197 | $262,400 | $104,200 | $158,200 |
| 2017 | $3,104 | $257,800 | $104,200 | $153,600 |
| 2016 | $2,888 | $237,100 | $104,200 | $132,900 |
| 2015 | $2,854 | $234,900 | $104,200 | $130,700 |
Source: Public Records
Map
Nearby Homes
Your Personal Tour Guide
Ask me questions while you tour the home.