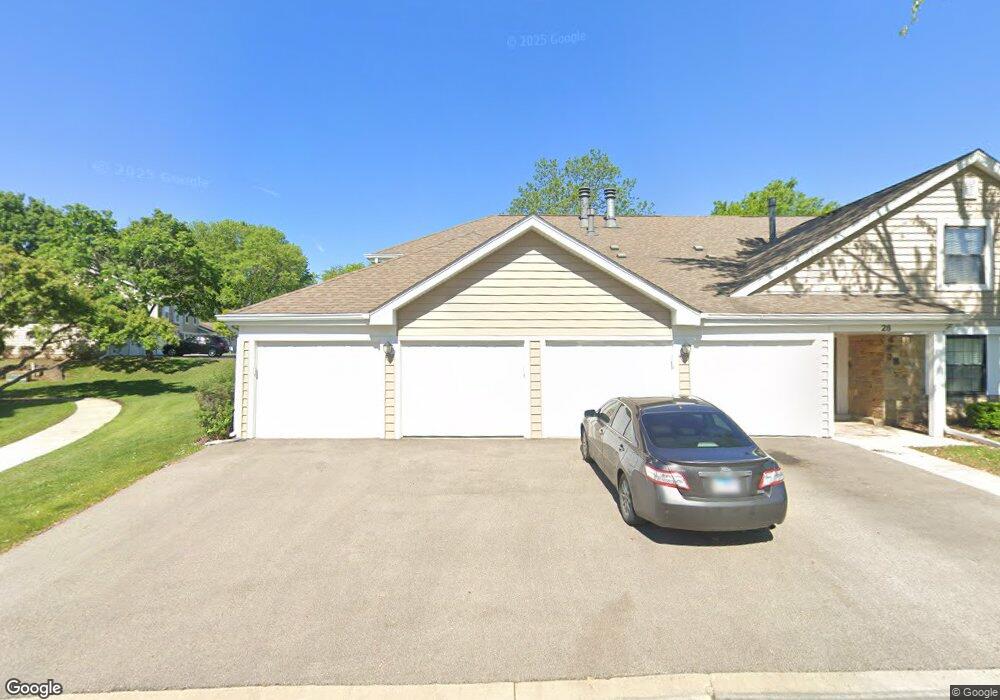
28 Stanton Ct Unit 1935L Schaumburg, IL 60193
East Schaumburg NeighborhoodEstimated Value: $287,000 - $302,782
3
Beds
--
Bath
1,383
Sq Ft
$213/Sq Ft
Est. Value
About This Home
This home is located at 28 Stanton Ct Unit 1935L, Schaumburg, IL 60193 and is currently estimated at $294,446, approximately $212 per square foot. 28 Stanton Ct Unit 1935L is a home located in Cook County with nearby schools including Michael Collins Elementary School, Robert Frost Junior High School, and J B Conant High School.
Ownership History
Date
Name
Owned For
Owner Type
Purchase Details
Closed on
Nov 3, 2020
Sold by
Abdalghani Osama H and Bnayat Chaghf
Bought by
Abdalghani Osama H S and Osmvia H S Abdalghani Trust
Current Estimated Value
Purchase Details
Closed on
May 10, 2019
Sold by
Tropea Giuseppe
Bought by
Abdalghani Osama H and Bnayat Chaghf
Purchase Details
Closed on
Oct 20, 2017
Sold by
Dugo Anna Maria
Bought by
Tropen Giuseppe
Purchase Details
Closed on
Aug 9, 2013
Sold by
Deines Patzer Lorene M
Bought by
Dugo Anna Maria
Purchase Details
Closed on
Oct 18, 2000
Sold by
Cole Taylor Bank
Bought by
Deines Patzer Lorene M
Home Financials for this Owner
Home Financials are based on the most recent Mortgage that was taken out on this home.
Original Mortgage
$88,500
Interest Rate
7.96%
Create a Home Valuation Report for This Property
The Home Valuation Report is an in-depth analysis detailing your home's value as well as a comparison with similar homes in the area
Home Values in the Area
Average Home Value in this Area
Purchase History
| Date | Buyer | Sale Price | Title Company |
|---|---|---|---|
| Abdalghani Osama H S | -- | Attorney | |
| Abdalghani Osama H | $200,000 | Greater Illinois Title | |
| Tropen Giuseppe | -- | None Available | |
| Dugo Anna Maria | $156,000 | Chicago Title Insurance Comp | |
| Deines Patzer Lorene M | $138,500 | -- |
Source: Public Records
Mortgage History
| Date | Status | Borrower | Loan Amount |
|---|---|---|---|
| Previous Owner | Tropea Giuseppe | $63,000 | |
| Previous Owner | Deines Patzer Lorene M | $88,500 |
Source: Public Records
Tax History Compared to Growth
Tax History
| Year | Tax Paid | Tax Assessment Tax Assessment Total Assessment is a certain percentage of the fair market value that is determined by local assessors to be the total taxable value of land and additions on the property. | Land | Improvement |
|---|---|---|---|---|
| 2024 | $5,735 | $20,474 | $4,156 | $16,318 |
| 2023 | $5,561 | $20,474 | $4,156 | $16,318 |
| 2022 | $5,561 | $20,474 | $4,156 | $16,318 |
| 2021 | $5,468 | $18,042 | $3,305 | $14,737 |
| 2020 | $5,374 | $18,042 | $3,305 | $14,737 |
| 2019 | $5,370 | $20,035 | $3,305 | $16,730 |
| 2018 | $4,197 | $13,985 | $2,644 | $11,341 |
| 2017 | $4,131 | $13,985 | $2,644 | $11,341 |
| 2016 | $3,863 | $13,985 | $2,644 | $11,341 |
| 2015 | $3,804 | $12,717 | $2,361 | $10,356 |
| 2014 | $3,763 | $12,717 | $2,361 | $10,356 |
| 2013 | $3,666 | $12,717 | $2,361 | $10,356 |
Source: Public Records
Map
Nearby Homes
- 28 Ascot Cir
- 100 N Summit Dr
- 121 Chatsworth Cir
- 284 Pembridge Ln Unit C1
- 127 Wolcott Ct Unit 114RO
- 164 Chatsworth Cir
- 31 Waterbury Ln Unit O1
- 249 Staffmark Ln
- 100 Superior Ct Unit L2
- 76 Allerton Dr Unit 76G3
- 25 Illinois Ave Unit M1
- 147 Fulbright Ln
- 600 Stone Circle Ct Unit W2
- 3 Trails Dr Unit W1
- 600 Hanover Ct Unit V1
- 7 Bethel Ln
- 220 S Roselle Rd Unit 324
- 12 N Waterford Dr Unit 130F
- 632 Bridgeview Point Unit 25C
- 300 S Roselle Rd Unit 307
- 28 Stanton Ct Unit A2
- 28 Stanton Ct Unit 1935L
- 28 Stanton Ct Unit 1935L
- 28 Stanton Ct Unit 1935L
- 28 Stanton Ct Unit 1B
- 28 Stanton Ct Unit B2
- 26 Stanton Ct Unit 1935R
- 26 Stanton Ct Unit 1935R
- 26 Stanton Ct Unit 1935R
- 26 Stanton Ct Unit 1935R
- 26 Stanton Ct Unit D2
- 376 Newgate Ct Unit 11346
- 376 Newgate Ct Unit 11346
- 376 Newgate Ct Unit 11346R
- 376 Newgate Ct Unit 11346
- 376 Newgate Ct Unit Z1
- 376 Newgate Ct Unit V1
- 27 Stanton Ct Unit 1934L
- 27 Stanton Ct Unit 1934L
- 27 Stanton Ct Unit 1934L