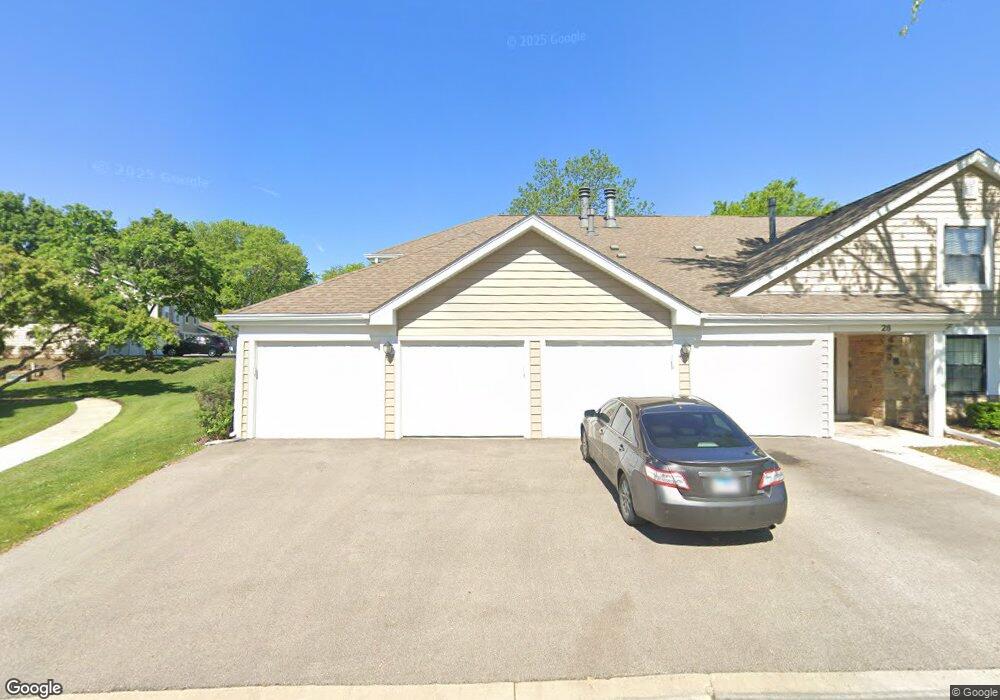
28 Stanton Ct Unit 1935L Schaumburg, IL 60193
East Schaumburg NeighborhoodEstimated Value: $268,000 - $279,884
2
Beds
--
Bath
1,400
Sq Ft
$195/Sq Ft
Est. Value
About This Home
This home is located at 28 Stanton Ct Unit 1935L, Schaumburg, IL 60193 and is currently estimated at $273,471, approximately $195 per square foot. 28 Stanton Ct Unit 1935L is a home located in Cook County with nearby schools including Michael Collins Elementary School, Robert Frost Junior High School, and J B Conant High School.
Ownership History
Date
Name
Owned For
Owner Type
Purchase Details
Closed on
Sep 7, 2021
Sold by
Le Vine Sheryl D
Bought by
28 Stanton Llc
Current Estimated Value
Purchase Details
Closed on
Jun 28, 2000
Sold by
Marrano Virginia L
Bought by
Levine Sheryl D
Home Financials for this Owner
Home Financials are based on the most recent Mortgage that was taken out on this home.
Original Mortgage
$110,000
Interest Rate
8.55%
Purchase Details
Closed on
Dec 15, 1998
Sold by
Lindahl Jenna L
Bought by
Marrano Virginia L
Purchase Details
Closed on
Mar 27, 1996
Sold by
Stein Douglas T and Stein Carolyn T
Bought by
Filippi Salvatore T
Home Financials for this Owner
Home Financials are based on the most recent Mortgage that was taken out on this home.
Original Mortgage
$88,200
Interest Rate
6.98%
Create a Home Valuation Report for This Property
The Home Valuation Report is an in-depth analysis detailing your home's value as well as a comparison with similar homes in the area
Home Values in the Area
Average Home Value in this Area
Purchase History
| Date | Buyer | Sale Price | Title Company |
|---|---|---|---|
| 28 Stanton Llc | $181,500 | Citywide Title Corporation | |
| Levine Sheryl D | $130,000 | -- | |
| Marrano Virginia L | $109,500 | -- | |
| Filippi Salvatore T | $98,000 | -- |
Source: Public Records
Mortgage History
| Date | Status | Borrower | Loan Amount |
|---|---|---|---|
| Previous Owner | Levine Sheryl D | $110,000 | |
| Previous Owner | Filippi Salvatore T | $88,200 |
Source: Public Records
Tax History Compared to Growth
Tax History
| Year | Tax Paid | Tax Assessment Tax Assessment Total Assessment is a certain percentage of the fair market value that is determined by local assessors to be the total taxable value of land and additions on the property. | Land | Improvement |
|---|---|---|---|---|
| 2024 | $4,952 | $17,681 | $3,589 | $14,092 |
| 2023 | $4,802 | $17,681 | $3,589 | $14,092 |
| 2022 | $4,802 | $17,681 | $3,589 | $14,092 |
| 2021 | $3,713 | $15,580 | $2,854 | $12,726 |
| 2020 | $3,717 | $15,580 | $2,854 | $12,726 |
| 2019 | $3,718 | $17,301 | $2,854 | $14,447 |
| 2018 | $2,593 | $12,077 | $2,283 | $9,794 |
| 2017 | $2,570 | $12,077 | $2,283 | $9,794 |
| 2016 | $2,646 | $12,077 | $2,283 | $9,794 |
| 2015 | $2,501 | $10,982 | $2,039 | $8,943 |
| 2014 | $2,489 | $10,982 | $2,039 | $8,943 |
| 2013 | $2,408 | $10,982 | $2,039 | $8,943 |
Source: Public Records
Map
Nearby Homes
- 350 Newgate Ct Unit 2Z
- 28 Ascot Cir
- 22 Ascot Cir
- 287 Pembridge Ln Unit B2
- 136 Wolcott Ct Unit O2
- 121 Chatsworth Cir
- 22 Waterbury Ln Unit N1
- 125 Cleveland Ct Unit M2
- 600 Eastview Ct Unit X1
- 147 Fulbright Ln
- 153 Fulbright Ln
- 601 Hanover Ct Unit Z2
- 609 Hanover Ct Unit X1
- 300 S Roselle Rd Unit 207
- 300 S Roselle Rd Unit 519
- 300 S Roselle Rd Unit 419
- 21 White Pine Dr
- 1871 Fox Run Dr Unit A
- 313 Lincoln St
- 751 Edgelake Point Unit 68C
- 28 Stanton Ct Unit A2
- 28 Stanton Ct Unit 1935L
- 28 Stanton Ct Unit 1935L
- 28 Stanton Ct Unit 1935L
- 28 Stanton Ct Unit 1B
- 28 Stanton Ct Unit B2
- 26 Stanton Ct Unit 1935R
- 26 Stanton Ct Unit 1935R
- 26 Stanton Ct Unit 1935R
- 26 Stanton Ct Unit 1935R
- 26 Stanton Ct Unit C1
- 26 Stanton Ct Unit D2
- 376 Newgate Ct Unit 11346
- 376 Newgate Ct Unit 11346
- 376 Newgate Ct Unit 11346R
- 376 Newgate Ct Unit 11346
- 376 Newgate Ct Unit Z1
- 376 Newgate Ct Unit V1
- 27 Stanton Ct Unit 1934L
- 27 Stanton Ct Unit 1934L