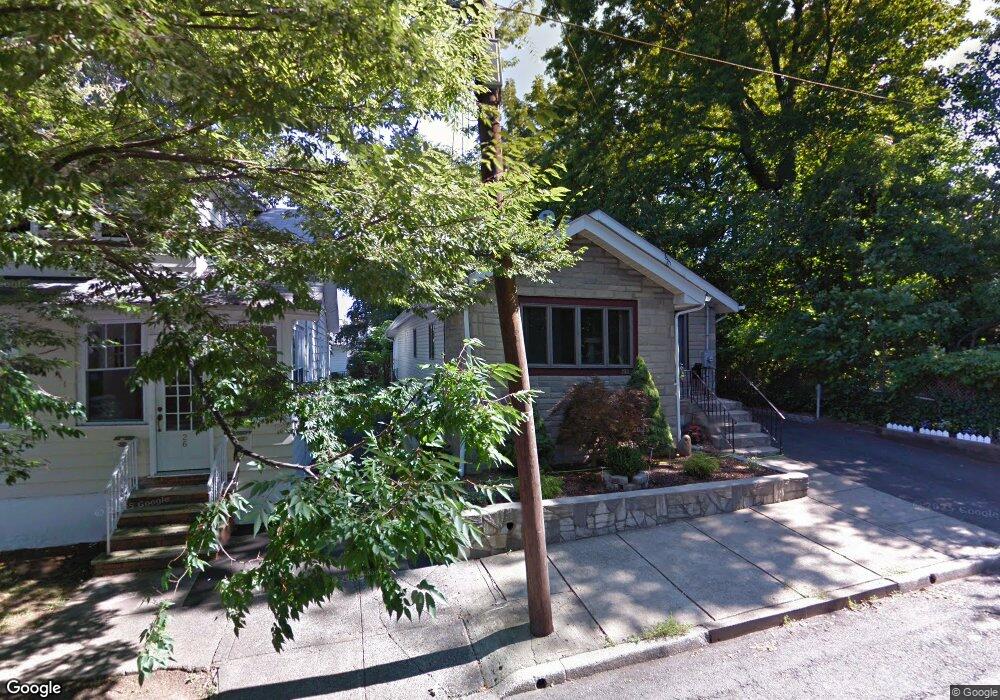
28 Stone St Unit 30 Bloomfield, NJ 07003
Estimated Value: $530,000 - $585,000
--
Bed
--
Bath
1,338
Sq Ft
$417/Sq Ft
Est. Value
About This Home
This home is located at 28 Stone St Unit 30, Bloomfield, NJ 07003 and is currently estimated at $558,161, approximately $417 per square foot. 28 Stone St Unit 30 is a home located in Essex County with nearby schools including Demarest School, Bloomfield Middle School, and Bloomfield High School.
Ownership History
Date
Name
Owned For
Owner Type
Purchase Details
Closed on
Dec 6, 2011
Sold by
Rodriguez Manuel G
Bought by
Jerez Cecilia
Current Estimated Value
Home Financials for this Owner
Home Financials are based on the most recent Mortgage that was taken out on this home.
Original Mortgage
$145,000
Outstanding Balance
$99,190
Interest Rate
4.01%
Mortgage Type
New Conventional
Estimated Equity
$458,971
Purchase Details
Closed on
Oct 30, 2008
Sold by
Mondsini Frank and Mondsini Michela
Bought by
Rodriguez Manuel G
Create a Home Valuation Report for This Property
The Home Valuation Report is an in-depth analysis detailing your home's value as well as a comparison with similar homes in the area
Home Values in the Area
Average Home Value in this Area
Purchase History
| Date | Buyer | Sale Price | Title Company |
|---|---|---|---|
| Jerez Cecilia | $201,000 | Foundation Title Llc | |
| Rodriguez Manuel G | -- | Prestige Title Agency Inc |
Source: Public Records
Mortgage History
| Date | Status | Borrower | Loan Amount |
|---|---|---|---|
| Open | Jerez Cecilia | $145,000 |
Source: Public Records
Tax History Compared to Growth
Tax History
| Year | Tax Paid | Tax Assessment Tax Assessment Total Assessment is a certain percentage of the fair market value that is determined by local assessors to be the total taxable value of land and additions on the property. | Land | Improvement |
|---|---|---|---|---|
| 2025 | $10,663 | $328,500 | $120,400 | $208,100 |
| 2024 | $10,663 | $326,300 | $120,400 | $205,900 |
| 2022 | $10,448 | $326,300 | $120,400 | $205,900 |
| 2021 | $10,256 | $326,300 | $120,400 | $205,900 |
| 2020 | $10,099 | $326,300 | $120,400 | $205,900 |
| 2019 | $9,124 | $229,200 | $94,000 | $135,200 |
| 2018 | $9,085 | $229,200 | $94,000 | $135,200 |
| 2017 | $8,948 | $229,200 | $94,000 | $135,200 |
| 2016 | $8,847 | $229,200 | $94,000 | $135,200 |
| 2015 | $8,767 | $229,200 | $94,000 | $135,200 |
| 2014 | $8,606 | $229,200 | $94,000 | $135,200 |
Source: Public Records
Map
Nearby Homes