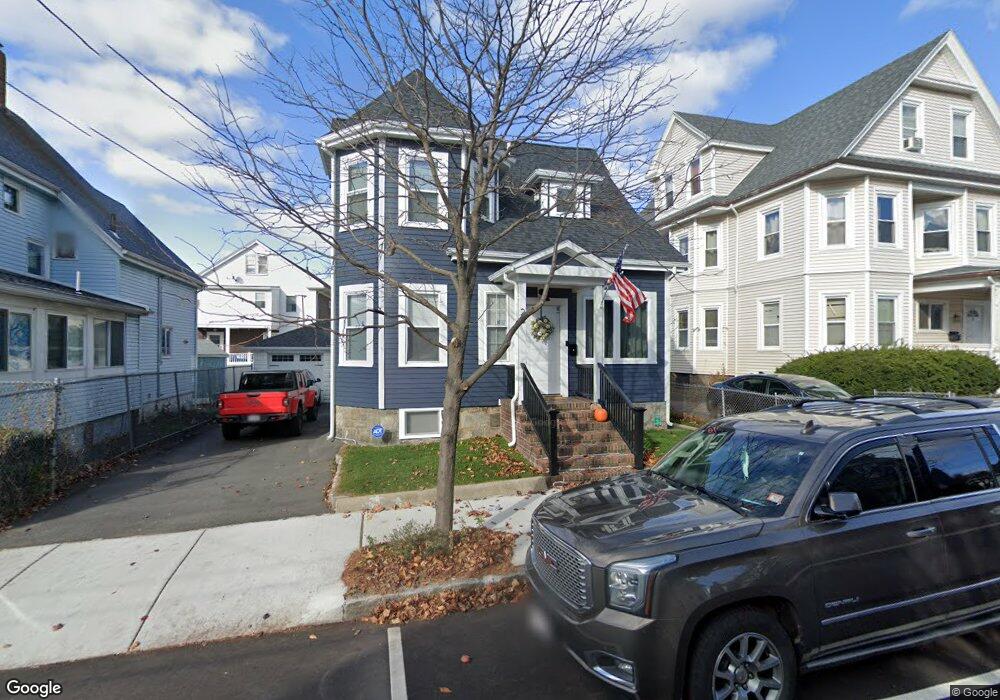
28 Swan St Everett, MA 02149
West Everett NeighborhoodEstimated Value: $555,000 - $640,000
3
Beds
2
Baths
9,999
Sq Ft
$60/Sq Ft
Est. Value
About This Home
This home is located at 28 Swan St, Everett, MA 02149 and is currently estimated at $596,468, approximately $59 per square foot. 28 Swan St is a home located in Middlesex County with nearby schools including Everett High School, Pioneer Charter School of Science, and St Anthony School.
Ownership History
Date
Name
Owned For
Owner Type
Purchase Details
Closed on
Jun 13, 2018
Sold by
Salvia Richard
Bought by
Salvia Richard M and Chaves Alexandra M
Current Estimated Value
Purchase Details
Closed on
Mar 22, 2005
Sold by
28 Swan St T and Tauro Daniel
Bought by
Salvia Richard
Purchase Details
Closed on
Sep 13, 2004
Sold by
Magliozzi Mary
Bought by
28 Swan Street T and Tauro Daniel
Purchase Details
Closed on
Jun 13, 2000
Sold by
Silvestre Gilbert S
Bought by
28 Swan St T and Magliozzi Paul
Home Financials for this Owner
Home Financials are based on the most recent Mortgage that was taken out on this home.
Original Mortgage
$140,000
Interest Rate
8.12%
Mortgage Type
Purchase Money Mortgage
Create a Home Valuation Report for This Property
The Home Valuation Report is an in-depth analysis detailing your home's value as well as a comparison with similar homes in the area
Home Values in the Area
Average Home Value in this Area
Purchase History
| Date | Buyer | Sale Price | Title Company |
|---|---|---|---|
| Salvia Richard M | -- | -- | |
| Salvia Richard | -- | -- | |
| 28 Swan Street T | $280,000 | -- | |
| 28 Swan St T | $100,000 | -- |
Source: Public Records
Mortgage History
| Date | Status | Borrower | Loan Amount |
|---|---|---|---|
| Previous Owner | 28 Swan St T | $176,000 | |
| Previous Owner | 28 Swan St T | $176,000 | |
| Previous Owner | 28 Swan St T | $140,000 | |
| Previous Owner | 28 Swan St T | $40,000 |
Source: Public Records
Tax History
| Year | Tax Paid | Tax Assessment Tax Assessment Total Assessment is a certain percentage of the fair market value that is determined by local assessors to be the total taxable value of land and additions on the property. | Land | Improvement |
|---|---|---|---|---|
| 2025 | $6,341 | $556,700 | $217,500 | $339,200 |
| 2024 | $5,975 | $521,400 | $208,000 | $313,400 |
| 2023 | $5,780 | $490,700 | $193,800 | $296,900 |
| 2022 | $4,773 | $460,700 | $184,400 | $276,300 |
| 2021 | $4,319 | $437,600 | $177,800 | $259,800 |
| 2020 | $4,505 | $423,400 | $167,800 | $255,600 |
| 2019 | $4,699 | $379,600 | $156,500 | $223,100 |
| 2018 | $4,207 | $305,300 | $124,800 | $180,500 |
| 2017 | $3,447 | $238,700 | $104,000 | $134,700 |
| 2016 | $3,364 | $232,800 | $103,300 | $129,500 |
| 2015 | $3,113 | $213,100 | $89,800 | $123,300 |
Source: Public Records
Map
Nearby Homes
- 48 Cleveland Ave
- 139 Bucknam St
- 340 Main St
- 15 Staples Ave Unit 45
- 15 Staples Ave Unit 31
- 21 Staples Ave Unit 26
- 21 Central Ave Unit 10
- 44 Walnut St
- 24 Corey St Unit 101
- 39 Parlin St Unit 203
- 17 Jones St Unit 2
- 30 Chelsea St Unit 210
- 37 Argyle St
- 9 Carter St
- 15 Waverly Ave
- 64 Perkins Ave
- 80 Main St Unit 9
- 80 Main St Unit 4
- 120 Wyllis Ave Unit 217
- 120 Wyllis Ave Unit 401
Your Personal Tour Guide
Ask me questions while you tour the home.