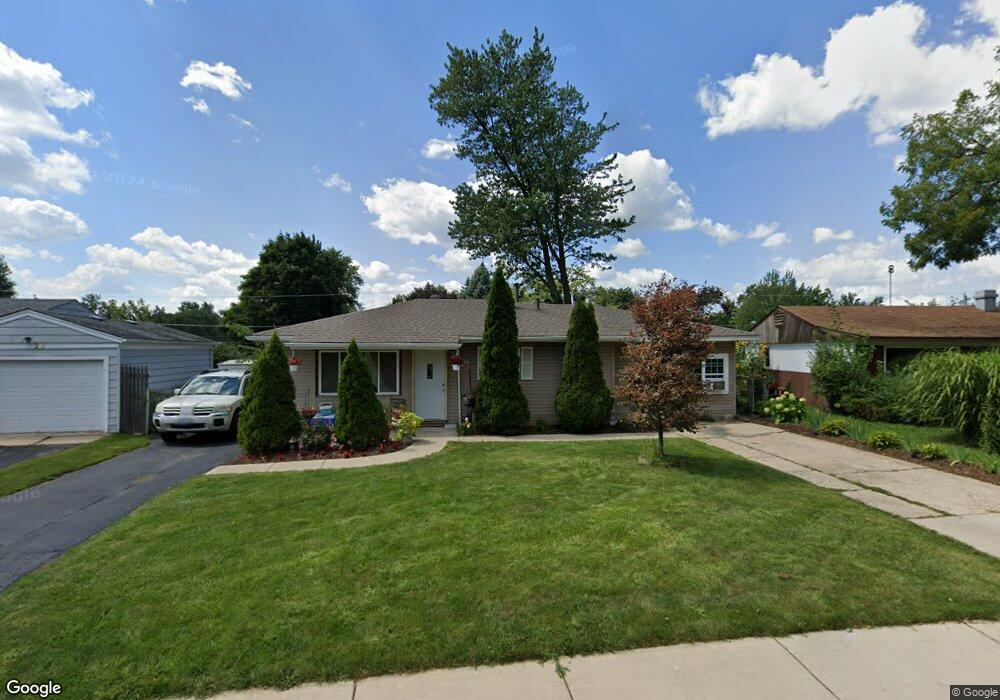
28 Thrush Rd Unit 3 Carpentersville, IL 60110
Estimated Value: $240,000 - $264,934
3
Beds
2
Baths
1,076
Sq Ft
$234/Sq Ft
Est. Value
About This Home
This home is located at 28 Thrush Rd Unit 3, Carpentersville, IL 60110 and is currently estimated at $251,734, approximately $233 per square foot. 28 Thrush Rd Unit 3 is a home located in Kane County with nearby schools including Meadowdale Elementary School, Carpentersville Middle School, and Dundee-Crown High School.
Ownership History
Date
Name
Owned For
Owner Type
Purchase Details
Closed on
Nov 30, 2010
Sold by
Federal Home Loan Mortgage Corporation
Bought by
Gutierrez Maria E
Current Estimated Value
Purchase Details
Closed on
Feb 22, 2010
Sold by
Vargas Guillermo
Bought by
Federal Home Loan Mortgage Corp
Purchase Details
Closed on
Dec 3, 2007
Sold by
Vargas Guillermo
Bought by
Vargas Guillermo and Salcedo Zuniga Alma Rosa
Home Financials for this Owner
Home Financials are based on the most recent Mortgage that was taken out on this home.
Original Mortgage
$171,000
Interest Rate
7.37%
Mortgage Type
New Conventional
Purchase Details
Closed on
Feb 28, 2006
Sold by
Guizar Jose
Bought by
Vargas Guillermo
Home Financials for this Owner
Home Financials are based on the most recent Mortgage that was taken out on this home.
Original Mortgage
$132,400
Interest Rate
7.75%
Mortgage Type
Fannie Mae Freddie Mac
Purchase Details
Closed on
Dec 23, 2005
Sold by
Lopez Jose J and Ramirez Katrina
Bought by
Guizar Jose
Home Financials for this Owner
Home Financials are based on the most recent Mortgage that was taken out on this home.
Original Mortgage
$96,000
Interest Rate
7.99%
Mortgage Type
Fannie Mae Freddie Mac
Purchase Details
Closed on
Dec 22, 2003
Sold by
Parra Abel and Parra Miriam
Bought by
Lopez Jose J and Moreno Francisco
Home Financials for this Owner
Home Financials are based on the most recent Mortgage that was taken out on this home.
Original Mortgage
$135,867
Interest Rate
5.91%
Mortgage Type
FHA
Purchase Details
Closed on
Aug 8, 2003
Sold by
Hubley Steve J and Hubley Laura
Bought by
Parra Abel and Parra Miriam
Home Financials for this Owner
Home Financials are based on the most recent Mortgage that was taken out on this home.
Original Mortgage
$95,200
Interest Rate
6.44%
Mortgage Type
Purchase Money Mortgage
Purchase Details
Closed on
Dec 9, 2000
Sold by
Hubley Steven J
Bought by
Hubley Steven J and Hubley Laura
Home Financials for this Owner
Home Financials are based on the most recent Mortgage that was taken out on this home.
Original Mortgage
$25,000
Interest Rate
7.69%
Mortgage Type
Credit Line Revolving
Create a Home Valuation Report for This Property
The Home Valuation Report is an in-depth analysis detailing your home's value as well as a comparison with similar homes in the area
Home Values in the Area
Average Home Value in this Area
Purchase History
| Date | Buyer | Sale Price | Title Company |
|---|---|---|---|
| Gutierrez Maria E | $49,000 | Attorneys Title Guaranty Fun | |
| Federal Home Loan Mortgage Corp | -- | None Available | |
| Vargas Guillermo | -- | Republic Title | |
| Vargas Guillermo | $165,500 | Chicago Title Insurance Comp | |
| Guizar Jose | $120,000 | Ticor Title Insurance Compan | |
| Lopez Jose J | $138,000 | Multiple | |
| Parra Abel | $119,000 | Multiple | |
| Hubley Steven J | -- | Wheatland Title |
Source: Public Records
Mortgage History
| Date | Status | Borrower | Loan Amount |
|---|---|---|---|
| Previous Owner | Vargas Guillermo | $171,000 | |
| Previous Owner | Vargas Guillermo | $132,400 | |
| Previous Owner | Guizar Jose | $96,000 | |
| Previous Owner | Lopez Jose J | $135,867 | |
| Previous Owner | Parra Abel | $95,200 | |
| Previous Owner | Hubley Steven J | $25,000 |
Source: Public Records
Tax History Compared to Growth
Tax History
| Year | Tax Paid | Tax Assessment Tax Assessment Total Assessment is a certain percentage of the fair market value that is determined by local assessors to be the total taxable value of land and additions on the property. | Land | Improvement |
|---|---|---|---|---|
| 2024 | $4,593 | $68,650 | $12,553 | $56,097 |
| 2023 | $4,518 | $61,769 | $11,295 | $50,474 |
| 2022 | $3,986 | $51,772 | $11,295 | $40,477 |
| 2021 | $3,885 | $48,883 | $10,665 | $38,218 |
| 2020 | $3,817 | $47,784 | $10,425 | $37,359 |
| 2019 | $3,600 | $45,362 | $9,897 | $35,465 |
| 2018 | $3,256 | $40,094 | $9,701 | $30,393 |
| 2017 | $3,108 | $37,506 | $9,075 | $28,431 |
| 2016 | $2,769 | $32,339 | $8,787 | $23,552 |
| 2015 | -- | $24,410 | $8,234 | $16,176 |
| 2014 | -- | $22,051 | $8,007 | $14,044 |
| 2013 | -- | $22,726 | $8,252 | $14,474 |
Source: Public Records
Map
Nearby Homes