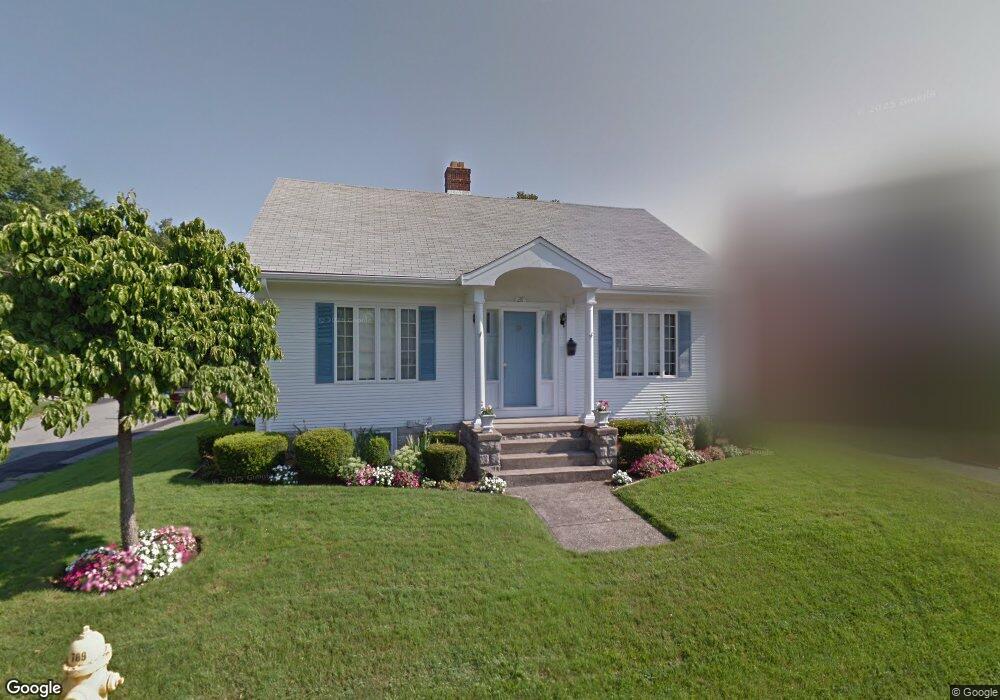
28 Thurston St Riverside, RI 02915
Riverside NeighborhoodEstimated Value: $455,728 - $519,000
3
Beds
1
Bath
1,890
Sq Ft
$257/Sq Ft
Est. Value
About This Home
This home is located at 28 Thurston St, Riverside, RI 02915 and is currently estimated at $485,682, approximately $256 per square foot. 28 Thurston St is a home located in Providence County with nearby schools including East Providence High School, St Luke Elementary School, and St Mary Academy-Bay View.
Ownership History
Date
Name
Owned For
Owner Type
Purchase Details
Closed on
Dec 28, 1994
Sold by
Stevens Lillian M Est
Bought by
Correa Daniel Q and Correa Mary
Current Estimated Value
Home Financials for this Owner
Home Financials are based on the most recent Mortgage that was taken out on this home.
Original Mortgage
$109,000
Interest Rate
9.2%
Mortgage Type
Purchase Money Mortgage
Purchase Details
Closed on
May 27, 1994
Sold by
Butler John F and Butler Kathleen
Bought by
Major Marguerite L
Create a Home Valuation Report for This Property
The Home Valuation Report is an in-depth analysis detailing your home's value as well as a comparison with similar homes in the area
Home Values in the Area
Average Home Value in this Area
Purchase History
| Date | Buyer | Sale Price | Title Company |
|---|---|---|---|
| Correa Daniel Q | $115,000 | -- | |
| Major Marguerite L | $123,000 | -- | |
| Correa Daniel Q | $115,000 | -- | |
| Major Marguerite L | $123,000 | -- |
Source: Public Records
Mortgage History
| Date | Status | Borrower | Loan Amount |
|---|---|---|---|
| Open | Major Marguerite L | $23,000 | |
| Closed | Major Marguerite L | $20,076 | |
| Closed | Major Marguerite L | $109,000 |
Source: Public Records
Tax History
| Year | Tax Paid | Tax Assessment Tax Assessment Total Assessment is a certain percentage of the fair market value that is determined by local assessors to be the total taxable value of land and additions on the property. | Land | Improvement |
|---|---|---|---|---|
| 2025 | $5,508 | $421,400 | $118,400 | $303,000 |
| 2024 | $5,249 | $342,400 | $98,700 | $243,700 |
| 2023 | $5,054 | $342,400 | $98,700 | $243,700 |
| 2022 | $4,855 | $222,100 | $58,100 | $164,000 |
| 2021 | $4,775 | $222,100 | $53,900 | $168,200 |
| 2020 | $4,573 | $222,100 | $53,900 | $168,200 |
| 2019 | $4,446 | $222,100 | $53,900 | $168,200 |
| 2018 | $4,436 | $193,900 | $52,400 | $141,500 |
| 2017 | $4,338 | $193,900 | $52,400 | $141,500 |
| 2016 | $4,316 | $193,900 | $52,400 | $141,500 |
| 2015 | $4,200 | $183,000 | $48,500 | $134,500 |
| 2014 | $4,200 | $183,000 | $48,500 | $134,500 |
Source: Public Records
Map
Nearby Homes
- 25 Winslow St
- 14 Benedict St
- 14 Winthrop St
- 103 Burnside Ave
- 151 Willett Ave Unit 2
- 15 Plaza Dr
- 85 Hilton Ave
- 15 Claire St
- 33 Pine St Unit 35
- 10 Booth Ave
- 28 Jefferson Ave
- 23 Albert Ave
- 72 Stowe Ave
- 6 Hazelton Rd
- 43 Bullocks Point Ave Unit 4A
- 65 Estrell Dr
- 41 White Ave
- 25 Bullocks Point Ave Unit 5C
- 33 Bullocks Point Ave Unit 5C
- 6 Fuller Ave
Your Personal Tour Guide
Ask me questions while you tour the home.