Estimated Value: $384,000 - $810,000
3
Beds
2
Baths
1,802
Sq Ft
$287/Sq Ft
Est. Value
About This Home
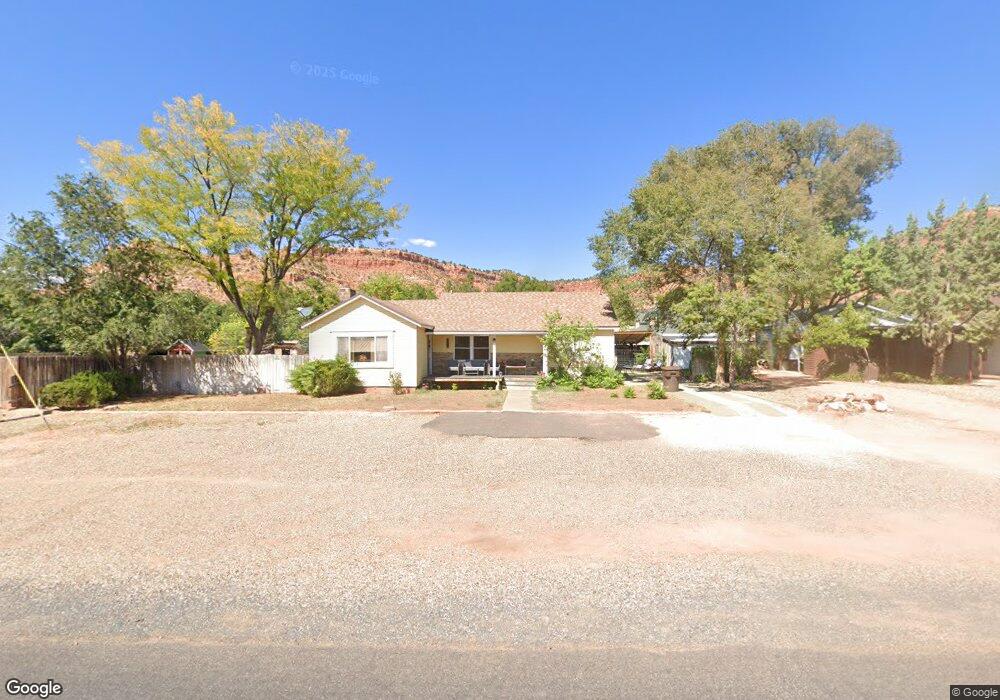
This home is located at 28 W 200 N, Kanab, UT 84741 and is currently estimated at $517,999, approximately $287 per square foot. 28 W 200 N is a home located in Kane County with nearby schools including Kanab Elementary School, Kanab Middle School, and Kanab High School.
Ownership History
Date
Name
Owned For
Owner Type
Purchase Details
Closed on
May 30, 2019
Sold by
William Leonard
Bought by
Eyetomic Llc
Current Estimated Value
Purchase Details
Closed on
Nov 13, 2015
Sold by
Wells Fargo Financial Utah Inc
Bought by
William Leonard and William Roxanne Leonard
Purchase Details
Closed on
May 1, 2015
Sold by
Carragh Carragh
Bought by
Wells Fargo Financial Utah Inc
Purchase Details
Closed on
Jun 25, 2009
Sold by
Glover Jeremy Michael
Bought by
Glover Carragh
Purchase Details
Closed on
Jun 13, 2006
Sold by
Maloney Marianne and Glover Carragh
Bought by
Glover Jeremy M and Glover Carragh
Create a Home Valuation Report for This Property
The Home Valuation Report is an in-depth analysis detailing your home's value as well as a comparison with similar homes in the area
Home Values in the Area
Average Home Value in this Area
Purchase History
| Date | Buyer | Sale Price | Title Company |
|---|---|---|---|
| Eyetomic Llc | -- | -- | |
| William Leonard | -- | -- | |
| Wells Fargo Financial Utah Inc | -- | -- | |
| Glover Carragh | -- | -- | |
| Glover Jeremy M | -- | -- |
Source: Public Records
Tax History Compared to Growth
Tax History
| Year | Tax Paid | Tax Assessment Tax Assessment Total Assessment is a certain percentage of the fair market value that is determined by local assessors to be the total taxable value of land and additions on the property. | Land | Improvement |
|---|---|---|---|---|
| 2025 | $1,909 | $215,746 | $60,988 | $154,758 |
| 2024 | $1,909 | $221,876 | $50,292 | $171,584 |
| 2023 | $3,118 | $204,180 | $48,055 | $156,125 |
| 2022 | $2,759 | $178,898 | $36,966 | $141,932 |
| 2021 | $2,496 | $242,854 | $51,700 | $191,154 |
| 2020 | $2,404 | $227,105 | $47,000 | $180,105 |
| 2019 | $1,140 | $190,797 | $46,068 | $144,729 |
| 2018 | $1,104 | $183,119 | $38,390 | $144,729 |
| 2017 | $1,051 | $166,474 | $34,900 | $131,574 |
| 2016 | $940 | $144,507 | $34,900 | $109,607 |
| 2015 | $904 | $135,910 | $34,900 | $101,010 |
| 2014 | $904 | $138,269 | $37,339 | $100,930 |
| 2013 | -- | $76,048 | $0 | $0 |
Source: Public Records
Map
Nearby Homes