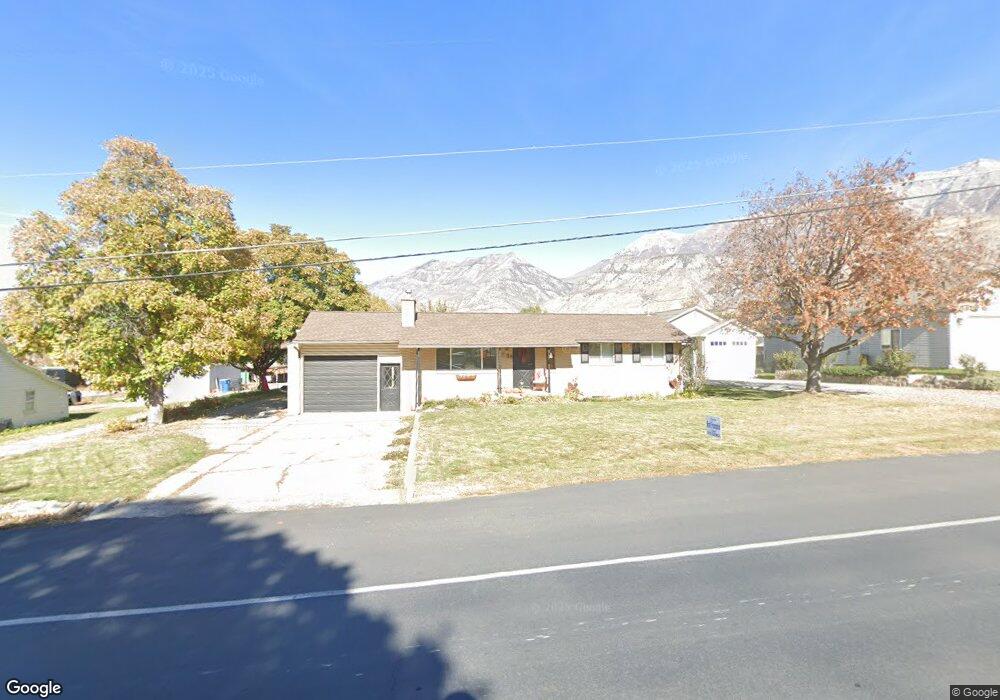
28 W 400 N Lindon, UT 84042
Estimated Value: $594,000 - $650,000
3
Beds
2
Baths
1,025
Sq Ft
$602/Sq Ft
Est. Value
About This Home
This home is located at 28 W 400 N, Lindon, UT 84042 and is currently estimated at $616,841, approximately $601 per square foot. 28 W 400 N is a home located in Utah County with nearby schools including Lindon Elementary School, Oak Canyon Junior High School, and Pleasant Grove High School.
Ownership History
Date
Name
Owned For
Owner Type
Purchase Details
Closed on
Nov 29, 2010
Sold by
Colledge Michelle
Bought by
Colledge Jared and Colledge Michelle
Current Estimated Value
Home Financials for this Owner
Home Financials are based on the most recent Mortgage that was taken out on this home.
Original Mortgage
$204,750
Outstanding Balance
$133,870
Interest Rate
4.17%
Mortgage Type
New Conventional
Estimated Equity
$482,971
Purchase Details
Closed on
Sep 26, 2003
Sold by
Bracken Evelyn
Bought by
Larsen Clair M and Larsen Patricia B
Home Financials for this Owner
Home Financials are based on the most recent Mortgage that was taken out on this home.
Original Mortgage
$148,500
Interest Rate
6.17%
Mortgage Type
Purchase Money Mortgage
Purchase Details
Closed on
Aug 1, 2002
Sold by
Bracken Newell H and Bracken Evelyn
Bought by
Bracken Newell H and Bracken Evelyn
Create a Home Valuation Report for This Property
The Home Valuation Report is an in-depth analysis detailing your home's value as well as a comparison with similar homes in the area
Home Values in the Area
Average Home Value in this Area
Purchase History
| Date | Buyer | Sale Price | Title Company |
|---|---|---|---|
| Colledge Jared | -- | Inwest Title Services Inc | |
| Larsen Clair M | -- | Affiliated First Title Comp | |
| Bracken Newell H | -- | -- |
Source: Public Records
Mortgage History
| Date | Status | Borrower | Loan Amount |
|---|---|---|---|
| Open | Colledge Jared | $204,750 | |
| Closed | Larsen Clair M | $148,500 |
Source: Public Records
Tax History Compared to Growth
Tax History
| Year | Tax Paid | Tax Assessment Tax Assessment Total Assessment is a certain percentage of the fair market value that is determined by local assessors to be the total taxable value of land and additions on the property. | Land | Improvement |
|---|---|---|---|---|
| 2025 | $2,376 | $309,375 | $331,300 | $231,200 |
| 2024 | $2,376 | $292,930 | $0 | $0 |
| 2023 | $2,295 | $303,930 | $0 | $0 |
| 2022 | $2,431 | $310,915 | $0 | $0 |
| 2021 | $2,035 | $392,500 | $208,000 | $184,500 |
| 2020 | $1,895 | $359,800 | $185,700 | $174,100 |
| 2019 | $1,683 | $333,300 | $159,200 | $174,100 |
| 2018 | $1,568 | $292,900 | $141,500 | $151,400 |
| 2017 | $1,464 | $146,630 | $0 | $0 |
| 2016 | $1,390 | $128,755 | $0 | $0 |
| 2015 | $1,471 | $128,755 | $0 | $0 |
| 2014 | $1,266 | $109,835 | $0 | $0 |
Source: Public Records
Map
Nearby Homes