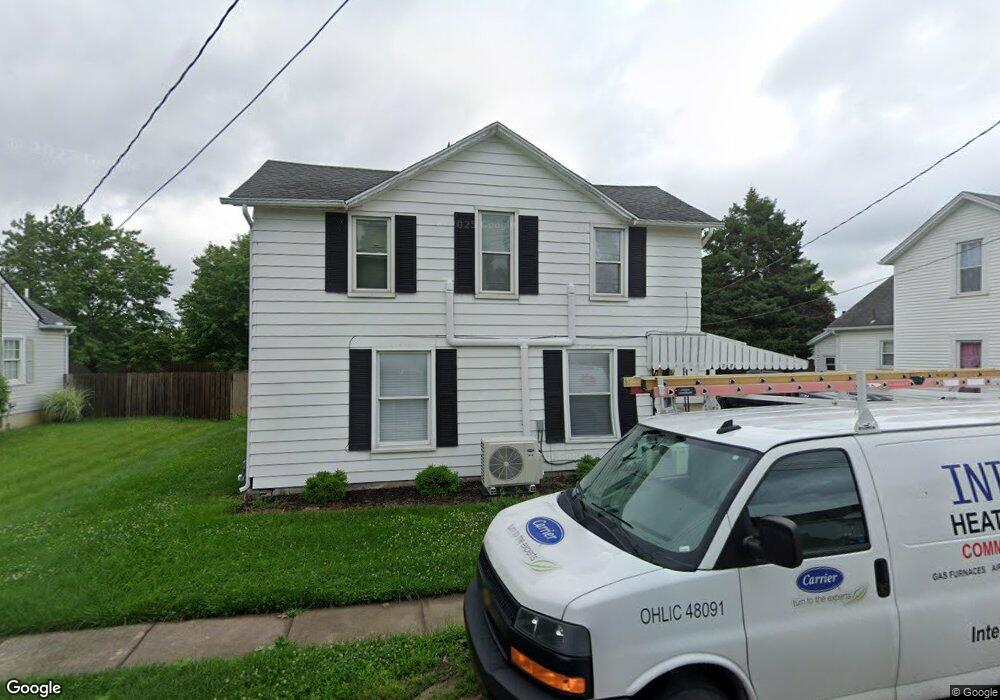
28 W Walnut St Phillipsburg, OH 45354
Estimated Value: $141,000 - $180,000
3
Beds
1
Bath
1,400
Sq Ft
$116/Sq Ft
Est. Value
About This Home
This home is located at 28 W Walnut St, Phillipsburg, OH 45354 and is currently estimated at $162,469, approximately $116 per square foot. 28 W Walnut St is a home located in Montgomery County with nearby schools including Union Elementary School and Northmont High School.
Ownership History
Date
Name
Owned For
Owner Type
Purchase Details
Closed on
Jul 15, 2025
Sold by
Blankenship Mancel
Bought by
Blankenship Thomas Scott
Current Estimated Value
Purchase Details
Closed on
Jul 2, 2012
Sold by
811 Eh Pooled
Bought by
Blankenship Mancel
Purchase Details
Closed on
Sep 29, 2011
Sold by
Hsbc Bank Usa N A
Bought by
Eh Pooled 811 Lp
Purchase Details
Closed on
Nov 23, 2005
Sold by
Schondelmyer Jason G and Schondelmyer Amy L
Bought by
Reed James T and Reed Elizabeth C
Home Financials for this Owner
Home Financials are based on the most recent Mortgage that was taken out on this home.
Original Mortgage
$91,800
Interest Rate
6.2%
Mortgage Type
Fannie Mae Freddie Mac
Purchase Details
Closed on
Mar 30, 2005
Sold by
Hoffman Brent A and Hoffman Shayne A
Bought by
Schondelmyer Jason G
Create a Home Valuation Report for This Property
The Home Valuation Report is an in-depth analysis detailing your home's value as well as a comparison with similar homes in the area
Home Values in the Area
Average Home Value in this Area
Purchase History
| Date | Buyer | Sale Price | Title Company |
|---|---|---|---|
| Blankenship Thomas Scott | -- | None Listed On Document | |
| Blankenship Mancel | $26,300 | None Available | |
| Eh Pooled 811 Lp | $21,000 | None Available | |
| Reed James T | $108,000 | None Available | |
| Schondelmyer Jason G | $55,000 | None Available |
Source: Public Records
Mortgage History
| Date | Status | Borrower | Loan Amount |
|---|---|---|---|
| Previous Owner | Reed James T | $91,800 |
Source: Public Records
Tax History Compared to Growth
Tax History
| Year | Tax Paid | Tax Assessment Tax Assessment Total Assessment is a certain percentage of the fair market value that is determined by local assessors to be the total taxable value of land and additions on the property. | Land | Improvement |
|---|---|---|---|---|
| 2024 | $2,898 | $38,280 | $8,130 | $30,150 |
| 2023 | $2,898 | $38,280 | $8,130 | $30,150 |
| 2022 | $2,704 | $27,140 | $5,760 | $21,380 |
| 2021 | $2,626 | $27,140 | $5,760 | $21,380 |
| 2020 | $2,573 | $27,140 | $5,760 | $21,380 |
| 2019 | $2,481 | $22,100 | $5,880 | $16,220 |
| 2018 | $2,363 | $22,100 | $5,880 | $16,220 |
| 2017 | $2,374 | $22,100 | $5,880 | $16,220 |
| 2016 | $2,343 | $19,270 | $5,880 | $13,390 |
| 2015 | $1,638 | $19,270 | $5,880 | $13,390 |
| 2014 | $1,638 | $19,270 | $5,880 | $13,390 |
| 2012 | -- | $27,320 | $5,880 | $21,440 |
Source: Public Records
Map
Nearby Homes
- 7141 Phillipsburg Union Rd
- 9527 Sweet Potato Ridge Rd
- 9021 N Montgomery County Line Rd
- 5170 Phillipsburg Union Rd
- 8375 N Montgomery County Line Rd
- 11629 Putnam Rd
- 11208 Putnam Rd
- 4832 Phillipsburg Union Rd
- 10351 Number Nine Rd
- 7415 Pleasant Plain Rd
- 8530 Talmadge Rd
- 8611 Blue Teal Dr
- 6543 Brookville Salem Rd
- 101 Westrock Farm Dr
- 139 Westrock Farm Dr
- 826 W Martindale Rd
- 51 Estate Dr
- 0000 Ludenn Ln
- 154 Irongate Dr
- 7991 Dodson Rd