
Seller's Agent in 2025
Paul LePere
The Hamptons Real Estate
(617) 803-2157
27 in this area
45 Total Sales

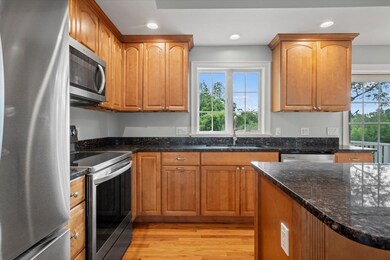
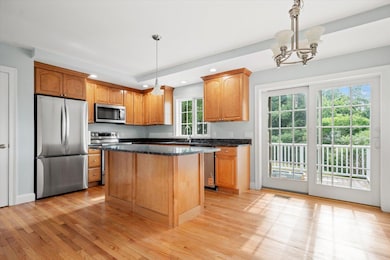
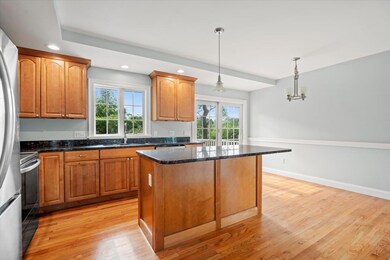
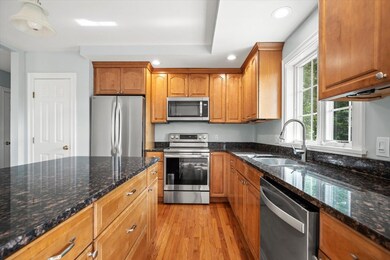
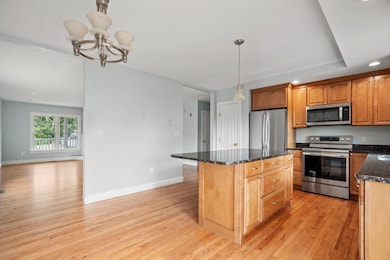
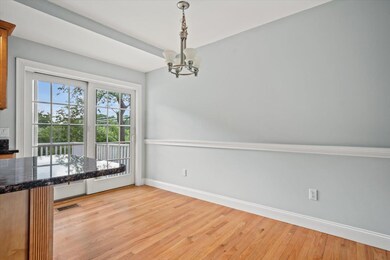
This condex is one of the nicest condos we've ever had for sale! Verifiable improvements totaling nearly $200,000 have been completed since January by the current realtor/developers—see attached list of upgrades. With over 2,100 square feet of living space, you'll never feel cramped. The home offers a total of 4 bedrooms, including one on the first level, and 3 full baths. Mostly new hardwood floors run throughout the home. The primary suite is a standout feature you'd expect to find in a high-end custom home—complete with a luxurious Jacuzzi tub and its own private deck. Additional features include central air, natural gas, a full basement, and a private lot set 297 feet back from the street. Best of all, there are no condo fees, no common areas, and only two units total. Your neighbors are quiet and take pride in maintaining their property. This is a truly exceptional offering—an absolute must-see! Owner/Broker interest.
Last Agent to Sell the Property
The Hamptons Real Estate License #011689 Listed on: 07/21/2025
| Date | Type | Sale Price | Title Company |
|---|---|---|---|
| Foreclosure Deed | $211,500 | -- | |
| Warranty Deed | $330,000 | -- |
| Date | Status | Loan Amount | Loan Type |
|---|---|---|---|
| Previous Owner | $264,000 | Purchase Money Mortgage |
| Date | Event | Price | List to Sale | Price per Sq Ft |
|---|---|---|---|---|
| 08/20/2025 08/20/25 | Sold | $595,000 | +2.6% | $279 / Sq Ft |
| 07/21/2025 07/21/25 | For Sale | $579,900 | -- | $272 / Sq Ft |
| Year | Tax Paid | Tax Assessment Tax Assessment Total Assessment is a certain percentage of the fair market value that is determined by local assessors to be the total taxable value of land and additions on the property. | Land | Improvement |
|---|---|---|---|---|
| 2024 | $6,138 | $523,700 | $167,800 | $355,900 |
| 2023 | $6,187 | $410,000 | $136,700 | $273,300 |
| 2022 | $5,433 | $410,000 | $136,700 | $273,300 |
| 2021 | $5,459 | $397,600 | $124,300 | $273,300 |
| 2020 | $5,130 | $321,200 | $99,500 | $221,700 |
| 2019 | $5,059 | $321,200 | $99,500 | $221,700 |
| 2018 | $5,083 | $312,800 | $91,100 | $221,700 |
| 2017 | $4,836 | $297,600 | $75,900 | $221,700 |
| 2016 | $4,402 | $297,600 | $75,900 | $221,700 |
| 2015 | $4,134 | $279,500 | $71,100 | $208,400 |
| 2014 | $4,268 | $279,500 | $71,100 | $208,400 |
| 2013 | $4,540 | $297,300 | $88,900 | $208,400 |
Seller's Agent in 2025
Paul LePere
The Hamptons Real Estate
(617) 803-2157
27 in this area
45 Total Sales
Buyer's Agent in 2025
Joel Simes
Simes City Realty
(978) 420-8410
1 in this area
21 Total Sales
Source: PrimeMLS
MLS Number: 5052526
APN: SEAB-000004-000002-000300
Disclaimer: Certain information contained herein is derived from information provided by parties other than Homes.com. All information provided is deemed reliable, but is not guaranteed to be accurate and should be independently verified.
![]() Copyright 2025 PrimeMLS, Inc. All rights reserved. This information is deemed reliable, but not guaranteed. The data relating to real estate displayed on this display comes in part from the IDX Program of PrimeMLS. The information being provided is for consumers’ personal, non-commercial use and may not be used for any purpose other than to identify prospective properties consumers may be interested in purchasing.
Copyright 2025 PrimeMLS, Inc. All rights reserved. This information is deemed reliable, but not guaranteed. The data relating to real estate displayed on this display comes in part from the IDX Program of PrimeMLS. The information being provided is for consumers’ personal, non-commercial use and may not be used for any purpose other than to identify prospective properties consumers may be interested in purchasing.