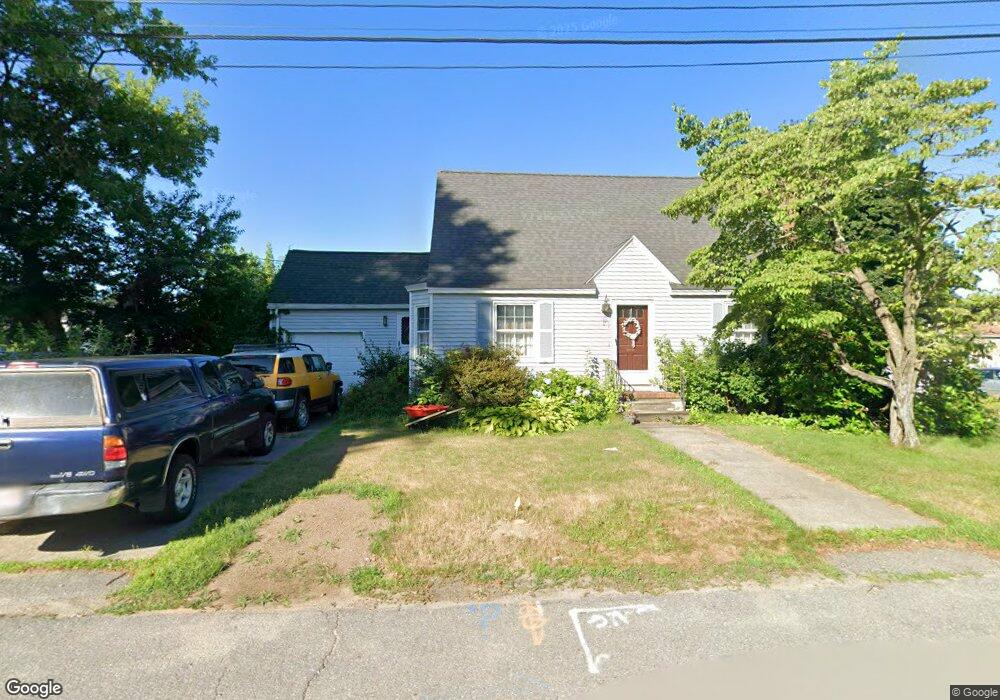
28 Wellesley Ave Lowell, MA 01851
Highlands NeighborhoodEstimated Value: $537,000 - $580,000
3
Beds
2
Baths
1,688
Sq Ft
$335/Sq Ft
Est. Value
About This Home
This home is located at 28 Wellesley Ave, Lowell, MA 01851 and is currently estimated at $565,135, approximately $334 per square foot. 28 Wellesley Ave is a home located in Middlesex County with nearby schools including Dr. Gertrude Bailey Elementary School, Abraham Lincoln Elementary School, and Charles W. Morey Elementary School.
Ownership History
Date
Name
Owned For
Owner Type
Purchase Details
Closed on
Aug 14, 2014
Sold by
Breen Philip J and Breen Kathleen A
Bought by
Philip J Breen Ft and Breen
Current Estimated Value
Create a Home Valuation Report for This Property
The Home Valuation Report is an in-depth analysis detailing your home's value as well as a comparison with similar homes in the area
Home Values in the Area
Average Home Value in this Area
Purchase History
| Date | Buyer | Sale Price | Title Company |
|---|---|---|---|
| Philip J Breen Ft | -- | -- | |
| Philip J Breen Ft | -- | -- |
Source: Public Records
Mortgage History
| Date | Status | Borrower | Loan Amount |
|---|---|---|---|
| Previous Owner | Philip J Breen Ft | $50,000 | |
| Previous Owner | Philip J Breen Ft | $40,000 |
Source: Public Records
Tax History Compared to Growth
Tax History
| Year | Tax Paid | Tax Assessment Tax Assessment Total Assessment is a certain percentage of the fair market value that is determined by local assessors to be the total taxable value of land and additions on the property. | Land | Improvement |
|---|---|---|---|---|
| 2025 | $5,623 | $489,800 | $213,600 | $276,200 |
| 2024 | $5,269 | $442,400 | $192,200 | $250,200 |
| 2023 | $5,121 | $412,300 | $167,100 | $245,200 |
| 2022 | $4,694 | $369,900 | $151,900 | $218,000 |
| 2021 | $4,411 | $327,700 | $132,200 | $195,500 |
| 2020 | $4,182 | $313,000 | $120,000 | $193,000 |
| 2019 | $4,167 | $296,800 | $121,500 | $175,300 |
| 2018 | $4,025 | $279,700 | $115,700 | $164,000 |
| 2017 | $3,863 | $258,900 | $105,200 | $153,700 |
| 2016 | $3,693 | $243,600 | $97,100 | $146,500 |
| 2015 | $3,629 | $234,400 | $93,200 | $141,200 |
| 2013 | $3,503 | $233,400 | $109,000 | $124,400 |
Source: Public Records
Map
Nearby Homes