Estimated Value: $437,261 - $491,000
2
Beds
2
Baths
1,710
Sq Ft
$265/Sq Ft
Est. Value
About This Home
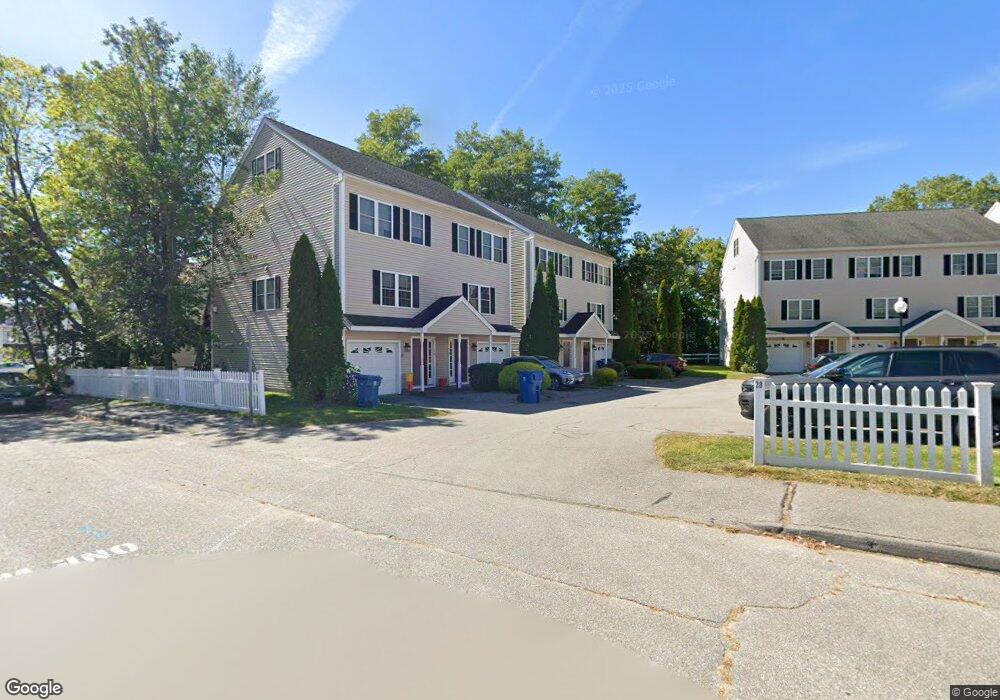
This home is located at 28 West St Unit 3C, Ayer, MA 01432 and is currently estimated at $453,565, approximately $265 per square foot. 28 West St Unit 3C is a home located in Middlesex County with nearby schools including Page Hilltop School, Lura A. White Elementary School, and Ayer Shirley Regional Middle School.
Ownership History
Date
Name
Owned For
Owner Type
Purchase Details
Closed on
Mar 30, 2012
Sold by
Colman Robert and Finn Catherine
Bought by
Colman Robert
Current Estimated Value
Purchase Details
Closed on
Jul 16, 2010
Sold by
Bank Of New York Mello
Bought by
Colman Robert and Finn Catherine
Home Financials for this Owner
Home Financials are based on the most recent Mortgage that was taken out on this home.
Original Mortgage
$157,500
Interest Rate
4.82%
Mortgage Type
Purchase Money Mortgage
Purchase Details
Closed on
Feb 1, 2010
Sold by
Clark James W and Bank Of New York Mello
Bought by
Bank Of New York Mello
Purchase Details
Closed on
Mar 1, 2005
Sold by
Chandler Place Llc
Bought by
Clark J William and Clark James W
Home Financials for this Owner
Home Financials are based on the most recent Mortgage that was taken out on this home.
Original Mortgage
$221,900
Interest Rate
5.73%
Mortgage Type
Purchase Money Mortgage
Create a Home Valuation Report for This Property
The Home Valuation Report is an in-depth analysis detailing your home's value as well as a comparison with similar homes in the area
Home Values in the Area
Average Home Value in this Area
Purchase History
| Date | Buyer | Sale Price | Title Company |
|---|---|---|---|
| Colman Robert | -- | -- | |
| Colman Robert | $175,000 | -- | |
| Bank Of New York Mello | $244,759 | -- | |
| Clark J William | $279,900 | -- |
Source: Public Records
Mortgage History
| Date | Status | Borrower | Loan Amount |
|---|---|---|---|
| Previous Owner | Colman Robert | $157,500 | |
| Previous Owner | Clark J William | $221,900 |
Source: Public Records
Tax History
| Year | Tax Paid | Tax Assessment Tax Assessment Total Assessment is a certain percentage of the fair market value that is determined by local assessors to be the total taxable value of land and additions on the property. | Land | Improvement |
|---|---|---|---|---|
| 2025 | $4,762 | $398,200 | $0 | $398,200 |
| 2024 | $4,283 | $349,600 | $0 | $349,600 |
| 2023 | $3,874 | $311,900 | $0 | $311,900 |
| 2022 | $3,815 | $284,300 | $0 | $284,300 |
| 2021 | $3,872 | $273,800 | $0 | $273,800 |
| 2020 | $3,765 | $267,000 | $0 | $267,000 |
| 2019 | $3,264 | $239,500 | $0 | $239,500 |
| 2018 | $3,221 | $223,200 | $0 | $223,200 |
| 2017 | $3,120 | $216,800 | $0 | $216,800 |
| 2016 | $2,968 | $204,300 | $0 | $204,300 |
| 2015 | $2,751 | $188,200 | $0 | $188,200 |
| 2014 | $2,422 | $172,000 | $0 | $172,000 |
Source: Public Records
Map
Nearby Homes
- 14 Brook St
- 23 Nashua St
- 0ABC Park St
- 21 High St
- 38 Norwood Ave
- 98 Pleasant St
- 63 E Main St
- 9 Gaskins Ln
- 100 Central Ave Unit 4
- 25 Pine Ridge Dr
- 24 Harvard Rd Unit C
- 7 Baldwin Ct Unit 7
- 37 Willard St
- 401 Autumn Ridge Dr
- 75 Sandy Pond Rd Unit 24
- 75 Sandy Pond Rd Unit 41
- 0 Ayer & Old Mill Rd
- 72 Dale Ln
- 124 Hazen Rd
- 64 Peabody Rd Unit E
- 28 West St Unit 7B
- 28 West St Unit 7A
- 28 West St Unit 6A
- 28 West St Unit 5B
- 28 West St Unit 5A
- 28 West St Unit 4C
- 28 West St Unit 4B
- 28 West St Unit 3B
- 28 West St Unit 3A
- 28 West St Unit 2B
- 28 West St Unit 2A
- 28 West St Unit 1B
- 28 West St Unit 1A
- 28 West St Unit 15
- 28 West St Unit 16 8
- 28 West St Unit 5 0
- 28 West St Unit c
- 28 West St Unit A,2
- 28 West St Unit 2/1
- 28 West St Unit 1/1
Your Personal Tour Guide
Ask me questions while you tour the home.