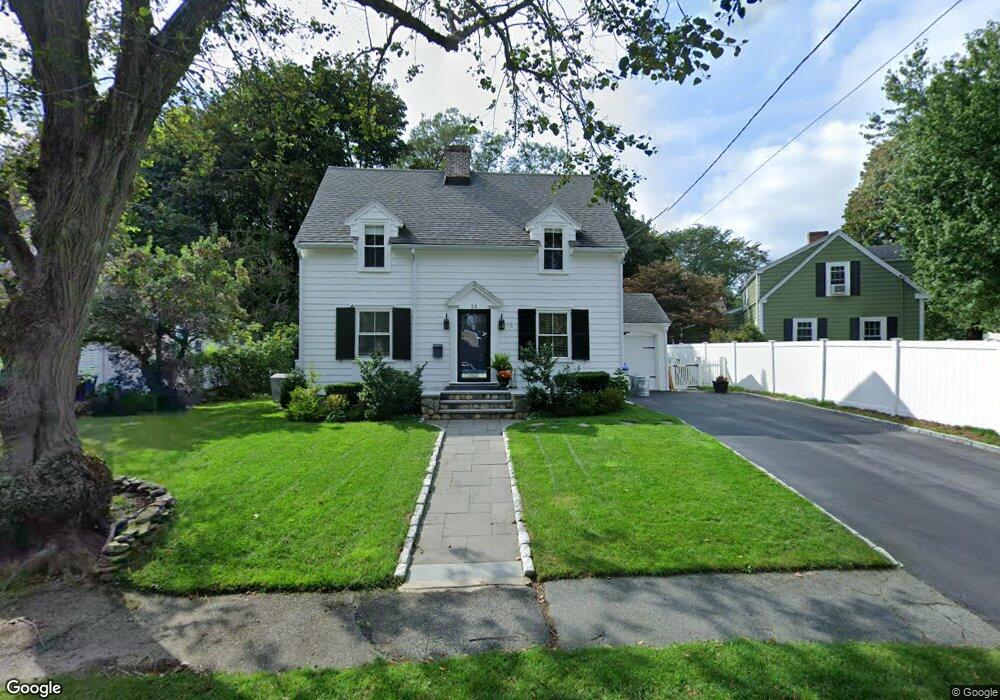
28 Windsor Rd Stoneham, MA 02180
Haywardville NeighborhoodEstimated Value: $776,271 - $877,000
3
Beds
2
Baths
1,312
Sq Ft
$626/Sq Ft
Est. Value
About This Home
This home is located at 28 Windsor Rd, Stoneham, MA 02180 and is currently estimated at $821,068, approximately $625 per square foot. 28 Windsor Rd is a home located in Middlesex County with nearby schools including Stoneham High School, Melrose Montessori School, and St. Patrick Elementary School.
Ownership History
Date
Name
Owned For
Owner Type
Purchase Details
Closed on
May 5, 2009
Sold by
Osterlund Carmel Anne and Fanaras Marlene Anne
Bought by
Mccormack 4Th George A and Forest Tara E
Current Estimated Value
Home Financials for this Owner
Home Financials are based on the most recent Mortgage that was taken out on this home.
Original Mortgage
$372,405
Interest Rate
4.86%
Mortgage Type
Purchase Money Mortgage
Purchase Details
Closed on
Dec 18, 2007
Sold by
Szloch Mary A
Bought by
Osterlund Carmel Anne and Fanaras Marlene Anne
Purchase Details
Closed on
Aug 1, 1989
Sold by
Ruby Daniel J
Bought by
Chang Alice
Home Financials for this Owner
Home Financials are based on the most recent Mortgage that was taken out on this home.
Original Mortgage
$206,400
Interest Rate
9.9%
Mortgage Type
Purchase Money Mortgage
Create a Home Valuation Report for This Property
The Home Valuation Report is an in-depth analysis detailing your home's value as well as a comparison with similar homes in the area
Home Values in the Area
Average Home Value in this Area
Purchase History
| Date | Buyer | Sale Price | Title Company |
|---|---|---|---|
| Mccormack 4Th George A | $385,000 | -- | |
| Osterlund Carmel Anne | -- | -- | |
| Chang Alice | $258,000 | -- | |
| Chang Alice | $258,000 | -- |
Source: Public Records
Mortgage History
| Date | Status | Borrower | Loan Amount |
|---|---|---|---|
| Open | Chang Alice | $361,000 | |
| Closed | Chang Alice | $369,967 | |
| Closed | Mccormack 4Th George A | $372,405 | |
| Previous Owner | Chang Alice | $206,400 |
Source: Public Records
Tax History
| Year | Tax Paid | Tax Assessment Tax Assessment Total Assessment is a certain percentage of the fair market value that is determined by local assessors to be the total taxable value of land and additions on the property. | Land | Improvement |
|---|---|---|---|---|
| 2025 | $7,048 | $689,000 | $393,600 | $295,400 |
| 2024 | $6,835 | $645,400 | $374,800 | $270,600 |
| 2023 | $6,547 | $589,800 | $337,300 | $252,500 |
| 2022 | $5,784 | $555,600 | $318,600 | $237,000 |
| 2021 | $5,767 | $533,000 | $299,900 | $233,100 |
| 2020 | $5,645 | $523,200 | $286,600 | $236,600 |
| 2019 | $5,490 | $489,300 | $275,400 | $213,900 |
| 2018 | $5,392 | $460,500 | $249,600 | $210,900 |
| 2017 | $5,468 | $441,300 | $233,800 | $207,500 |
| 2016 | $5,150 | $405,500 | $215,800 | $189,700 |
| 2015 | $5,162 | $398,300 | $215,800 | $182,500 |
| 2014 | $5,055 | $374,700 | $197,900 | $176,800 |
Source: Public Records
Map
Nearby Homes
- 53 Perkins St
- 33 Lake Ave
- 159 Franklin St Unit D2
- 159 Franklin St Unit C2
- 159 Franklin St Unit E6
- 35 Maple Rd
- 17 Franklin St
- 137 Franklin St Unit 102
- 601 Franklin St Unit 2
- 11 Ludlow Ave
- 24 Ellsworth Ave
- 23 Ellsworth Ave
- 43-51 Albion St Unit C9
- 12 Lovis Ave
- 51 Spring St
- 9 Lovis Ave
- 62 Maple St
- 51 Melrose St Unit 1C
- 51 Melrose St Unit 1A
- 300 Park Terrace Dr Unit 354
Your Personal Tour Guide
Ask me questions while you tour the home.