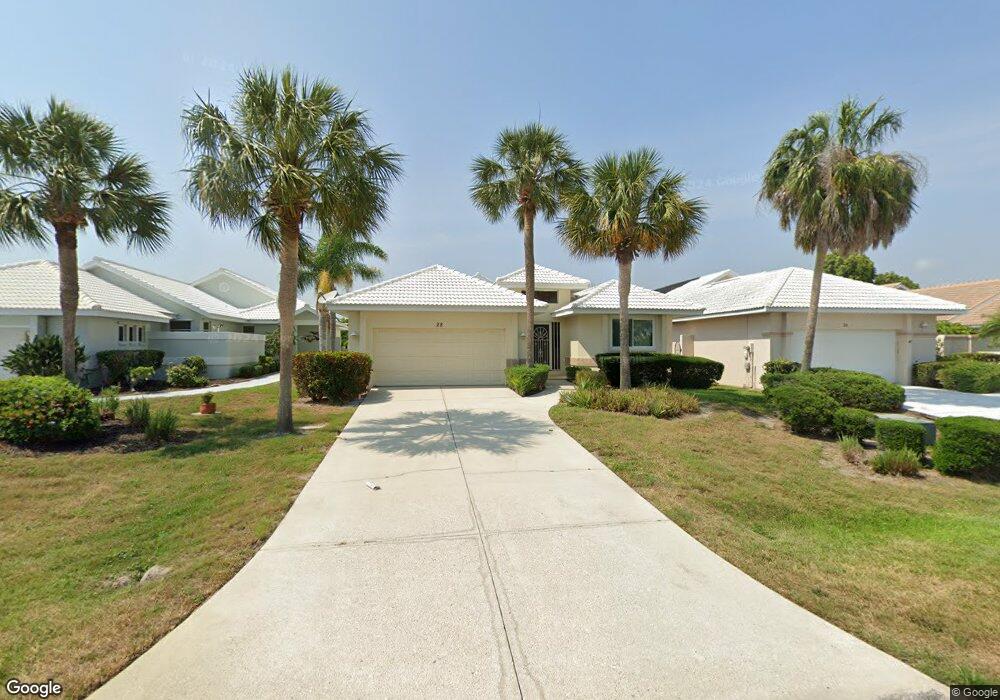
28 Windward Ct Placida, FL 33946
Estimated Value: $365,000 - $653,000
Studio
3
Baths
1,953
Sq Ft
$253/Sq Ft
Est. Value
About This Home
This home is located at 28 Windward Ct, Placida, FL 33946 and is currently estimated at $493,717, approximately $252 per square foot. 28 Windward Ct is a home located in Charlotte County with nearby schools including Vineland Elementary School, L.A. Ainger Middle School, and Lemon Bay High School.
Ownership History
Date
Name
Owned For
Owner Type
Purchase Details
Closed on
Mar 3, 2025
Sold by
Mcguane Gale
Bought by
Hermon Todd and Mary Gale Mcguane Irrevocable Mcguane
Current Estimated Value
Purchase Details
Closed on
May 31, 2002
Sold by
Antle Bruce R and Antle Darlene
Bought by
Mcguane Gale
Home Financials for this Owner
Home Financials are based on the most recent Mortgage that was taken out on this home.
Original Mortgage
$199,900
Interest Rate
6.92%
Mortgage Type
New Conventional
Purchase Details
Closed on
Mar 23, 1999
Sold by
Moncrief Moncrieff Elizabeth Kelley and Moncrief Lavin Elizabeth Kelley
Bought by
Antle Bruce R and Antle Darlene P
Home Financials for this Owner
Home Financials are based on the most recent Mortgage that was taken out on this home.
Original Mortgage
$120,000
Interest Rate
6.74%
Purchase Details
Closed on
Mar 11, 1994
Sold by
Cape Haze Corp
Bought by
Moncrieff Elizabeth Kelley
Create a Home Valuation Report for This Property
The Home Valuation Report is an in-depth analysis detailing your home's value as well as a comparison with similar homes in the area
Home Values in the Area
Average Home Value in this Area
Purchase History
| Date | Buyer | Sale Price | Title Company |
|---|---|---|---|
| Hermon Todd | $100 | None Listed On Document | |
| Mcguane Gale | -- | -- | |
| Mcguane Gale | $249,900 | -- | |
| Antle Bruce R | $150,000 | -- | |
| Moncrieff Elizabeth Kelley | -- | -- |
Source: Public Records
Mortgage History
| Date | Status | Borrower | Loan Amount |
|---|---|---|---|
| Previous Owner | Mcguane Gale | $199,900 | |
| Previous Owner | Antle Bruce R | $120,000 |
Source: Public Records
Tax History
| Year | Tax Paid | Tax Assessment Tax Assessment Total Assessment is a certain percentage of the fair market value that is determined by local assessors to be the total taxable value of land and additions on the property. | Land | Improvement |
|---|---|---|---|---|
| 2025 | $2,462 | $205,497 | -- | -- |
| 2024 | $3,236 | $199,706 | -- | -- |
| 2023 | $3,236 | $192,992 | $0 | $0 |
| 2022 | $3,142 | $188,242 | $0 | $0 |
| 2021 | $3,123 | $182,759 | $0 | $0 |
| 2020 | $2,371 | $180,236 | $0 | $0 |
| 2019 | $2,973 | $176,184 | $0 | $0 |
| 2018 | $2,588 | $172,899 | $0 | $0 |
| 2017 | $2,561 | $169,343 | $0 | $0 |
| 2016 | $2,546 | $165,860 | $0 | $0 |
| 2015 | $2,154 | $164,707 | $0 | $0 |
| 2014 | $2,145 | $163,400 | $0 | $0 |
Source: Public Records
Map
Nearby Homes
- 212 Westwind Dr
- 211 Westwind Dr
- 2 Windward Place
- 14 Windward Terrace
- 219 Westwind Dr
- 6 Windward Place
- 4 Windward Way
- 3971 Cape Haze Dr
- 3944 Cape Haze Dr
- 7 Windward Rd
- 19 Windward Rd
- 105 Westwind Dr
- 3929 Cape Haze Dr Unit 101
- 3929 Cape Haze Dr Unit 105
- 3927 Cape Haze Dr Unit 205
- 3927 Cape Haze Dr Unit 204
- 8 Windward Rd
- 201 Arlington Dr
- 3923 Cape Haze Dr Unit 306
- 3923 Cape Haze Dr Unit 304
- 30 Windward Ct
- 26 Windward Ct
- 32 Windward Ct
- 24 Windward Ct
- 34 Windward Ct
- 22 Windward Ct
- 36 Windward Ct
- 20 Windward Ct
- 18 Windward Ct
- 204 Westwind Dr
- 202 Westwind Dr
- 200 Westwind Dr
- 16 Windward Ct
- 11 Windward Terrace
- 9 Windward Terrace
- 13 Windward Terrace
- 7 Windward Terrace
- 15 Windward Terrace
- 17 Windward Terrace
- 209 Westwind Dr
Your Personal Tour Guide
Ask me questions while you tour the home.