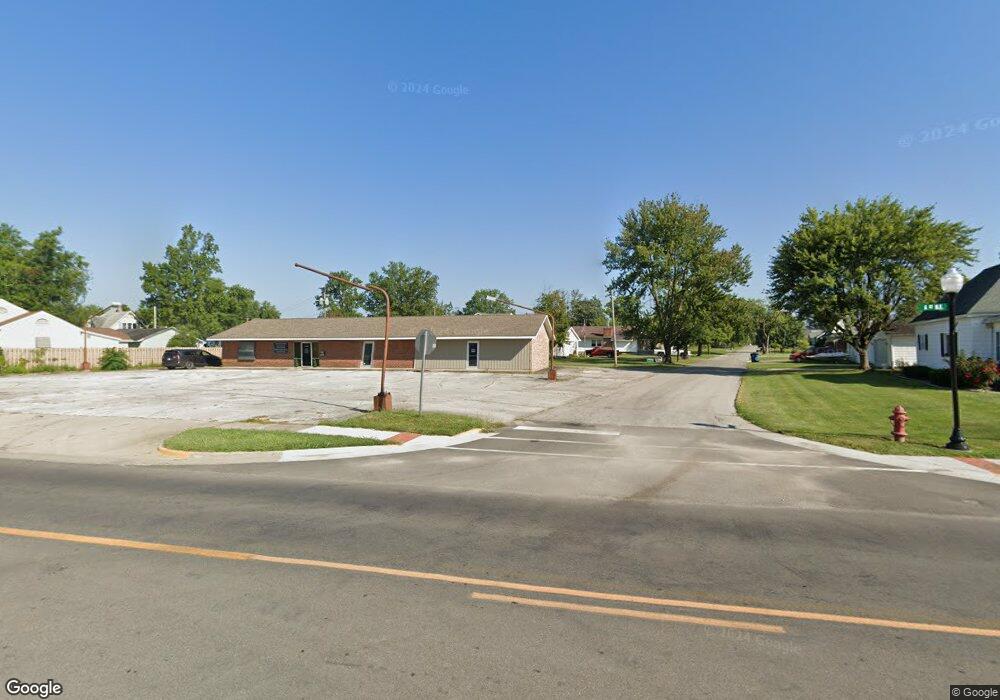
280 8th St NE Linton, IN 47441
Estimated Value: $151,000 - $264,000
--
Bed
2
Baths
1,600
Sq Ft
$129/Sq Ft
Est. Value
About This Home
This home is located at 280 8th St NE, Linton, IN 47441 and is currently estimated at $206,149, approximately $128 per square foot. 280 8th St NE is a home located in Greene County with nearby schools including Linton-Stockton Elementary School, Linton-Stockton Junior High School, and Linton-Stockton High School.
Ownership History
Date
Name
Owned For
Owner Type
Purchase Details
Closed on
Apr 17, 2025
Sold by
Mcbride Teresa A and Kluesner Teresa A
Bought by
Kluesner Tony M and Kluesner Teresa A
Current Estimated Value
Purchase Details
Closed on
Nov 7, 2019
Sold by
Mcbride Kevin M and Mcbride Teresa A
Bought by
Mcbride Teresa A
Purchase Details
Closed on
Apr 24, 2006
Sold by
Dayhoff David W and Dayhoff Lisa B
Bought by
Mcbride Kevin M and Mcbride Teresa A
Create a Home Valuation Report for This Property
The Home Valuation Report is an in-depth analysis detailing your home's value as well as a comparison with similar homes in the area
Home Values in the Area
Average Home Value in this Area
Purchase History
| Date | Buyer | Sale Price | Title Company |
|---|---|---|---|
| Kluesner Tony M | -- | None Listed On Document | |
| Mcbride Teresa A | -- | None Available | |
| Mcbride Kevin M | -- | None Available |
Source: Public Records
Tax History Compared to Growth
Tax History
| Year | Tax Paid | Tax Assessment Tax Assessment Total Assessment is a certain percentage of the fair market value that is determined by local assessors to be the total taxable value of land and additions on the property. | Land | Improvement |
|---|---|---|---|---|
| 2024 | $1,098 | $108,600 | $17,300 | $91,300 |
| 2023 | $1,088 | $107,600 | $17,300 | $90,300 |
| 2022 | $1,472 | $112,800 | $17,300 | $95,500 |
| 2021 | $1,356 | $104,000 | $17,300 | $86,700 |
| 2020 | $1,356 | $104,000 | $17,300 | $86,700 |
| 2019 | $1,038 | $104,400 | $17,300 | $87,100 |
| 2018 | $894 | $91,400 | $17,300 | $74,100 |
| 2017 | $903 | $92,600 | $17,300 | $75,300 |
| 2016 | $898 | $92,200 | $17,400 | $74,800 |
| 2014 | $1,131 | $106,600 | $17,400 | $89,200 |
| 2013 | -- | $105,800 | $17,200 | $88,600 |
Source: Public Records
Map
Nearby Homes