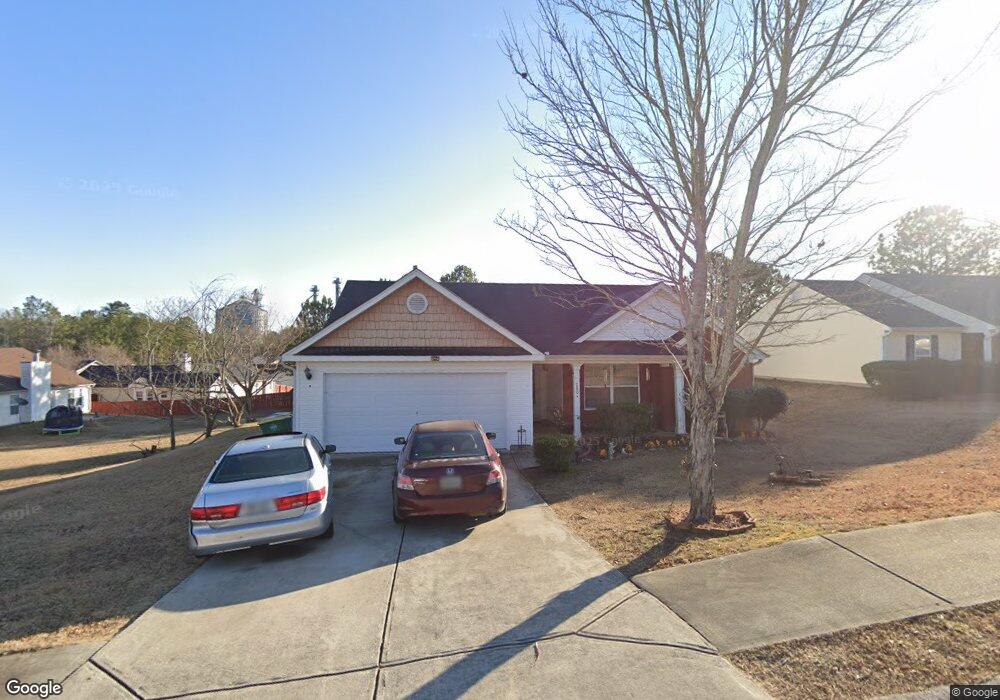
280 Bowden Ln Unit LOT 3F Athens, GA 30606
Estimated Value: $289,000 - $339,000
3
Beds
2
Baths
1,490
Sq Ft
$208/Sq Ft
Est. Value
About This Home
This home is located at 280 Bowden Ln Unit LOT 3F, Athens, GA 30606 and is currently estimated at $309,588, approximately $207 per square foot. 280 Bowden Ln Unit LOT 3F is a home located in Clarke County with nearby schools including Whitehead Road Elementary School, Burney-Harris-Lyons Middle School, and Clarke Central High School.
Ownership History
Date
Name
Owned For
Owner Type
Purchase Details
Closed on
Oct 31, 2013
Sold by
Guest James C
Bought by
Flint Pamela A
Current Estimated Value
Home Financials for this Owner
Home Financials are based on the most recent Mortgage that was taken out on this home.
Original Mortgage
$107,908
Outstanding Balance
$80,429
Interest Rate
4.37%
Mortgage Type
FHA
Estimated Equity
$229,159
Purchase Details
Closed on
Apr 12, 2013
Sold by
Faust Malcolm S
Bought by
Guest James C
Purchase Details
Closed on
Jun 30, 2006
Sold by
Not Provided
Bought by
Faust Malcolm S
Home Financials for this Owner
Home Financials are based on the most recent Mortgage that was taken out on this home.
Original Mortgage
$146,500
Interest Rate
6.6%
Mortgage Type
New Conventional
Purchase Details
Closed on
Nov 29, 2004
Sold by
J & V Development Inc
Bought by
Star Home Builders Inc
Create a Home Valuation Report for This Property
The Home Valuation Report is an in-depth analysis detailing your home's value as well as a comparison with similar homes in the area
Home Values in the Area
Average Home Value in this Area
Purchase History
| Date | Buyer | Sale Price | Title Company |
|---|---|---|---|
| Flint Pamela A | $109,900 | -- | |
| Guest James C | $47,600 | -- | |
| Faust Malcolm S | $146,500 | -- | |
| Star Home Builders Inc | $38,000 | -- |
Source: Public Records
Mortgage History
| Date | Status | Borrower | Loan Amount |
|---|---|---|---|
| Open | Flint Pamela A | $107,908 | |
| Previous Owner | Faust Malcolm S | $146,500 |
Source: Public Records
Tax History Compared to Growth
Tax History
| Year | Tax Paid | Tax Assessment Tax Assessment Total Assessment is a certain percentage of the fair market value that is determined by local assessors to be the total taxable value of land and additions on the property. | Land | Improvement |
|---|---|---|---|---|
| 2025 | $2,970 | $112,894 | $12,000 | $100,894 |
| 2024 | $2,970 | $109,533 | $12,000 | $97,533 |
| 2023 | $2,160 | $104,110 | $12,000 | $92,110 |
| 2022 | $2,606 | $91,685 | $10,400 | $81,285 |
| 2021 | $2,180 | $74,676 | $10,400 | $64,276 |
| 2020 | $2,092 | $72,082 | $10,400 | $61,682 |
| 2019 | $1,943 | $67,217 | $8,800 | $58,417 |
| 2018 | $1,498 | $54,134 | $8,800 | $45,334 |
| 2017 | $1,379 | $50,605 | $8,800 | $41,805 |
| 2016 | $1,097 | $42,305 | $8,800 | $33,505 |
| 2015 | $1,037 | $40,473 | $8,800 | $31,673 |
| 2014 | $1,028 | $40,163 | $8,800 | $31,363 |
Source: Public Records
Map
Nearby Homes
- 560 Bethany Ct
- 240 Bowden Ln
- 114 Kara Dr
- 369 Westchester Dr
- 121 Chadds Ct
- 584 Edgewood Dr
- 533 Edgewood Dr
- 155 Hunters Pointe Dr
- 104 Westchester Cir Unit 4
- 275 Westchester Cir
- 105 Westchester Dr Unit A8
- 105 Westchester Dr Unit A8
- 105 Westchester Dr Unit E5
- 160 Magnolia Blossom Way
- 110 S Homewood Dr
- 140 Breckenridge Ln
- 280 Bowden Ln
- 272 Bowden Ln
- 265 Kirby Ln
- 288 Bowden Ln
- 255 Kirby Ln
- 330 Sarah Dr Unit LOT14F
- 330 Sarah Dr
- 340 Sarah Dr
- 281 Bowden Ln
- 273 Bowden Ln
- 289 Bowden Ln Unit LOT10B
- 289 Bowden Ln
- 245 Kirby Ln
- 320 Sarah Dr
- 320 Sarah Drive Lot13f
- 265 Bowden Ln
- 355 Sarah Dr
- 235 Kirby Ln
- 257 Bowden Ln
- 295 Kirby Ln