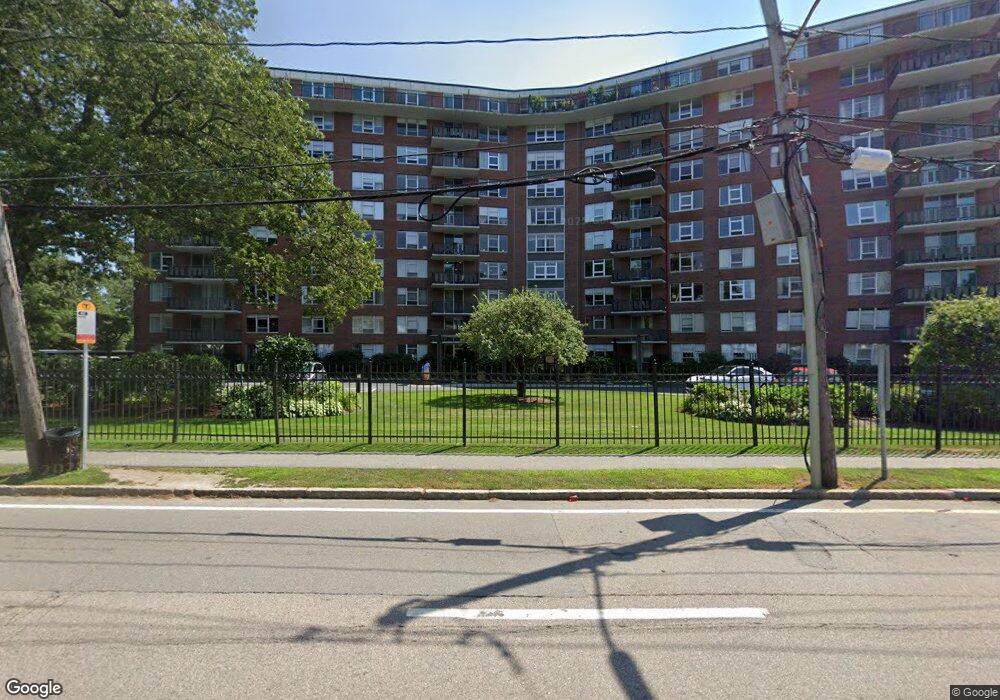
280 Boylston St Unit 101 Newton, MA 02459
Thompsonville NeighborhoodEstimated Value: $413,000 - $648,000
1
Bed
1
Bath
810
Sq Ft
$604/Sq Ft
Est. Value
About This Home
This home is located at 280 Boylston St Unit 101, Newton, MA 02459 and is currently estimated at $489,268, approximately $604 per square foot. 280 Boylston St Unit 101 is a home located in Middlesex County with nearby schools including Bowen School, Memorial Spaulding Elementary School, and Oak Hill Middle School.
Ownership History
Date
Name
Owned For
Owner Type
Purchase Details
Closed on
Aug 30, 2018
Sold by
Moore Patricia A
Bought by
Davis Sigalit
Current Estimated Value
Home Financials for this Owner
Home Financials are based on the most recent Mortgage that was taken out on this home.
Original Mortgage
$296,000
Outstanding Balance
$257,598
Interest Rate
4.5%
Mortgage Type
New Conventional
Estimated Equity
$231,670
Purchase Details
Closed on
Dec 2, 2004
Sold by
Goldman Amy B and Goldman Michael M
Bought by
Moore Patricia Ann
Purchase Details
Closed on
Jul 30, 1999
Sold by
Hinds Doris M
Bought by
Goldman Amy B and Goldman Michael M
Home Financials for this Owner
Home Financials are based on the most recent Mortgage that was taken out on this home.
Original Mortgage
$157,700
Interest Rate
7.61%
Mortgage Type
Purchase Money Mortgage
Purchase Details
Closed on
Sep 12, 1997
Sold by
280 Boylston St Rt and Ellis Edward
Bought by
Hinds Doris M
Create a Home Valuation Report for This Property
The Home Valuation Report is an in-depth analysis detailing your home's value as well as a comparison with similar homes in the area
Home Values in the Area
Average Home Value in this Area
Purchase History
| Date | Buyer | Sale Price | Title Company |
|---|---|---|---|
| Davis Sigalit | $370,000 | -- | |
| Moore Patricia Ann | $254,000 | -- | |
| Goldman Amy B | $166,000 | -- | |
| Hinds Doris M | $146,000 | -- |
Source: Public Records
Mortgage History
| Date | Status | Borrower | Loan Amount |
|---|---|---|---|
| Open | Davis Sigalit | $296,000 | |
| Previous Owner | Hinds Doris M | $157,700 |
Source: Public Records
Tax History Compared to Growth
Tax History
| Year | Tax Paid | Tax Assessment Tax Assessment Total Assessment is a certain percentage of the fair market value that is determined by local assessors to be the total taxable value of land and additions on the property. | Land | Improvement |
|---|---|---|---|---|
| 2025 | $3,660 | $373,500 | $0 | $373,500 |
| 2024 | $3,539 | $362,600 | $0 | $362,600 |
| 2023 | $3,459 | $339,800 | $0 | $339,800 |
| 2022 | $3,575 | $339,800 | $0 | $339,800 |
| 2021 | $6,855 | $339,800 | $0 | $339,800 |
| 2020 | $3,548 | $339,800 | $0 | $339,800 |
| 2019 | $3,261 | $312,100 | $0 | $312,100 |
| 2018 | $3,117 | $288,100 | $0 | $288,100 |
| 2017 | $2,670 | $240,100 | $0 | $240,100 |
| 2016 | $2,530 | $222,300 | $0 | $222,300 |
| 2015 | $2,458 | $211,700 | $0 | $211,700 |
Source: Public Records
Map
Nearby Homes
- 280 Boylston St Unit 203
- 280 Boylston St Unit 905
- 280 Boylston St Unit 710
- 280 Boylston St Unit 908
- 280 Boylston St Unit 415
- 280 Boylston St Unit 511
- 38 Tanglewood Rd
- 41-43 John Unit B
- 250 Hammond Pond Pkwy Unit 1604N
- 250 Hammond Pond Pkwy Unit 1002N
- 250 Hammond Pond Pkwy Unit 614S
- 250 Hammond Pond Pkwy Unit 603S
- 250 Hammond Pond Pkwy Unit 615N
- 250 Hammond Pond Pkwy Unit 306N
- 79 Florence St Unit 600S
- 79 Florence St Unit 402S
- 80 Louise Rd Unit 82
- 5 Heathwood Ln
- 811 Heath St
- 799 Heath St Unit 2
- 280 Boylston St Unit 304
- 280 Boylston St Unit PH8
- 280 Boylston St Unit 904,280
- 280 Boylston St Unit 101,280
- 280 Boylston St Unit 215,280
- 280 Boylston St Unit 208,280
- 280 Boylston St Unit 607,280
- 280 Boylston St Unit 212,280
- 280 Boylston St Unit 704,280
- 280 Boylston St Unit 709,280
- 280 Boylston St Unit 807,280
- 280 Boylston St Unit 508-280
- 280 Boylston St Unit 112
- 280 Boylston St Unit 1008
- 280 Boylston St Unit PH1015
- 280 Boylston St Unit PH06
- 280 Boylston St Unit PH-5
- 280 Boylston St Unit 210
- 280 Boylston St Unit 209
- 280 Boylston St Unit 208