Estimated Value: $179,000 - $206,000
Studio
--
Bath
1,584
Sq Ft
$119/Sq Ft
Est. Value
About This Home
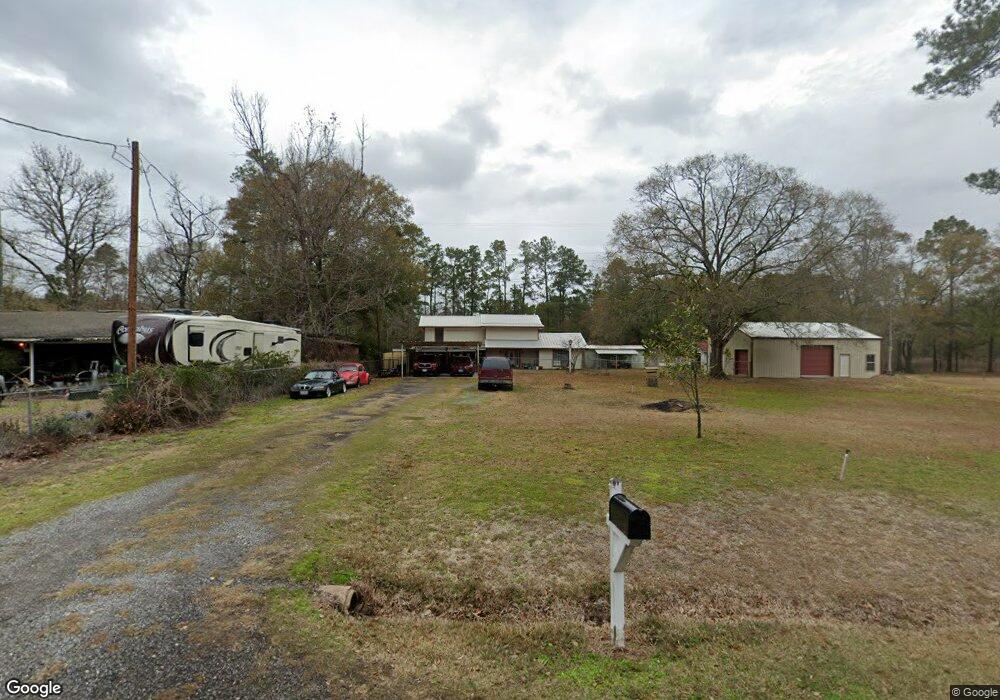
This home is located at 280 Doris St, Vidor, TX 77662 and is currently estimated at $189,116, approximately $119 per square foot. 280 Doris St is a home located in Orange County.
Ownership History
Date
Name
Owned For
Owner Type
Purchase Details
Closed on
Sep 20, 2006
Sold by
Ktl Properties Llc
Bought by
Matlock Clarence L and Matlock Cheryl J
Current Estimated Value
Home Financials for this Owner
Home Financials are based on the most recent Mortgage that was taken out on this home.
Original Mortgage
$83,600
Outstanding Balance
$49,617
Interest Rate
6.55%
Mortgage Type
New Conventional
Estimated Equity
$139,499
Purchase Details
Closed on
Feb 22, 2006
Sold by
Wells Fargo Bank National Association As Trus
Bought by
Matlock Clarence L
Create a Home Valuation Report for This Property
The Home Valuation Report is an in-depth analysis detailing your home's value as well as a comparison with similar homes in the area
Purchase History
| Date | Buyer | Sale Price | Title Company |
|---|---|---|---|
| Matlock Clarence L | -- | Satc | |
| Matlock Clarence L | -- | -- | |
| Ktl Properties Llc | -- | Fidelity National Title |
Source: Public Records
Mortgage History
| Date | Status | Borrower | Loan Amount |
|---|---|---|---|
| Open | Matlock Clarence L | $83,600 |
Source: Public Records
Tax History
| Year | Tax Paid | Tax Assessment Tax Assessment Total Assessment is a certain percentage of the fair market value that is determined by local assessors to be the total taxable value of land and additions on the property. | Land | Improvement |
|---|---|---|---|---|
| 2025 | $2,910 | $188,499 | $5,625 | $182,874 |
| 2024 | $814 | $189,223 | $5,625 | $183,598 |
| 2023 | $2,427 | $172,686 | $5,625 | $167,061 |
| 2022 | $1,710 | $152,915 | $5,625 | $147,290 |
| 2021 | $2,389 | $128,431 | $5,625 | $135,720 |
| 2020 | $2,238 | $132,435 | $5,625 | $126,810 |
| 2019 | $1,792 | $92,695 | $5,625 | $87,070 |
| 2018 | $2,246 | $117,595 | $5,625 | $111,970 |
| 2017 | $2,330 | $117,595 | $5,625 | $111,970 |
| 2016 | $2,090 | $109,465 | $5,625 | $103,840 |
| 2015 | $1,748 | $103,574 | $5,625 | $97,949 |
| 2014 | $1,748 | $88,626 | $5,625 | $83,001 |
Source: Public Records
Map
Nearby Homes
- Lot 14 Ironwood Dr
- 397 Stephenson Rd
- Lot #18 N Brook Dr
- Lot #17 N Brook Dr
- Lot #3 N Brook Dr
- Lot #16 N Brook Dr
- Lot #4 N Brook Dr
- Lot #2 N Brook Dr
- Lot #5 N Brook Dr
- 6125 Settlement Way
- 422 Texla Rd
- 6115 Pipeline Rd
- 270 Pug Rd
- 140 Princeton St
- 635 Highway 2802 Unit 635 Texla Rd
- 635 Texla Rd
- 4670 N Main St
- 1330 Hwy 1311
- 635 Windmill Way
- 1330 Highway 1131
Your Personal Tour Guide
Ask me questions while you tour the home.