Estimated Value: $165,000 - $200,136
3
Beds
2
Baths
2,088
Sq Ft
$88/Sq Ft
Est. Value
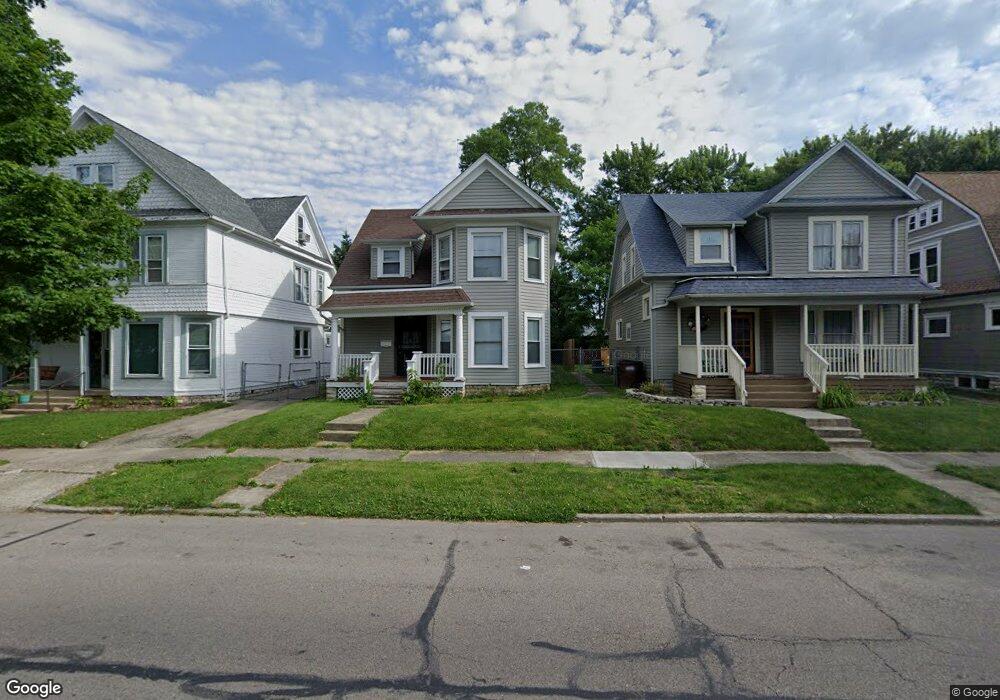
About This Home
This home is located at 280 E 2nd St, Xenia, OH 45385 and is currently estimated at $184,784, approximately $88 per square foot. 280 E 2nd St is a home located in Greene County with nearby schools including Xenia High School, Summit Academy Community School for Alternative Learners - Xenia, and Legacy Christian Academy.
Ownership History
Date
Name
Owned For
Owner Type
Purchase Details
Closed on
Jan 19, 2022
Sold by
Hemmingway William R and Abdurrasheed Haneef Naeem
Bought by
Abdurrasheed Haneef Naeem and Abdurrasheed Kardiata Ba
Current Estimated Value
Purchase Details
Closed on
Apr 29, 2016
Sold by
Ahmed Investments Llc
Bought by
Hemmingway William R
Home Financials for this Owner
Home Financials are based on the most recent Mortgage that was taken out on this home.
Original Mortgage
$8,836,900
Interest Rate
3.71%
Mortgage Type
FHA
Purchase Details
Closed on
Jul 6, 2015
Sold by
Wilson Martha A and David Whitney E
Bought by
Ahmed Investments Llc
Create a Home Valuation Report for This Property
The Home Valuation Report is an in-depth analysis detailing your home's value as well as a comparison with similar homes in the area
Home Values in the Area
Average Home Value in this Area
Purchase History
| Date | Buyer | Sale Price | Title Company |
|---|---|---|---|
| Abdurrasheed Haneef Naeem | $17,000 | None Listed On Document | |
| Hemmingway William R | $90,000 | Hallmark Title | |
| Ahmed Investments Llc | $21,500 | Attorney |
Source: Public Records
Mortgage History
| Date | Status | Borrower | Loan Amount |
|---|---|---|---|
| Previous Owner | Hemmingway William R | $8,836,900 |
Source: Public Records
Tax History
| Year | Tax Paid | Tax Assessment Tax Assessment Total Assessment is a certain percentage of the fair market value that is determined by local assessors to be the total taxable value of land and additions on the property. | Land | Improvement |
|---|---|---|---|---|
| 2024 | $2,255 | $51,780 | $3,370 | $48,410 |
| 2023 | $2,216 | $51,780 | $3,370 | $48,410 |
| 2022 | $1,937 | $38,610 | $2,700 | $35,910 |
| 2021 | $1,963 | $38,610 | $2,700 | $35,910 |
| 2020 | $1,881 | $38,610 | $2,700 | $35,910 |
| 2019 | $1,593 | $30,790 | $2,700 | $28,090 |
| 2018 | $1,600 | $30,790 | $2,700 | $28,090 |
| 2017 | $924 | $30,790 | $2,700 | $28,090 |
| 2016 | $924 | $17,460 | $2,700 | $14,760 |
| 2015 | $902 | $17,460 | $2,700 | $14,760 |
| 2014 | $5,388 | $17,460 | $2,700 | $14,760 |
Source: Public Records
Map
Nearby Homes
Your Personal Tour Guide
Ask me questions while you tour the home.