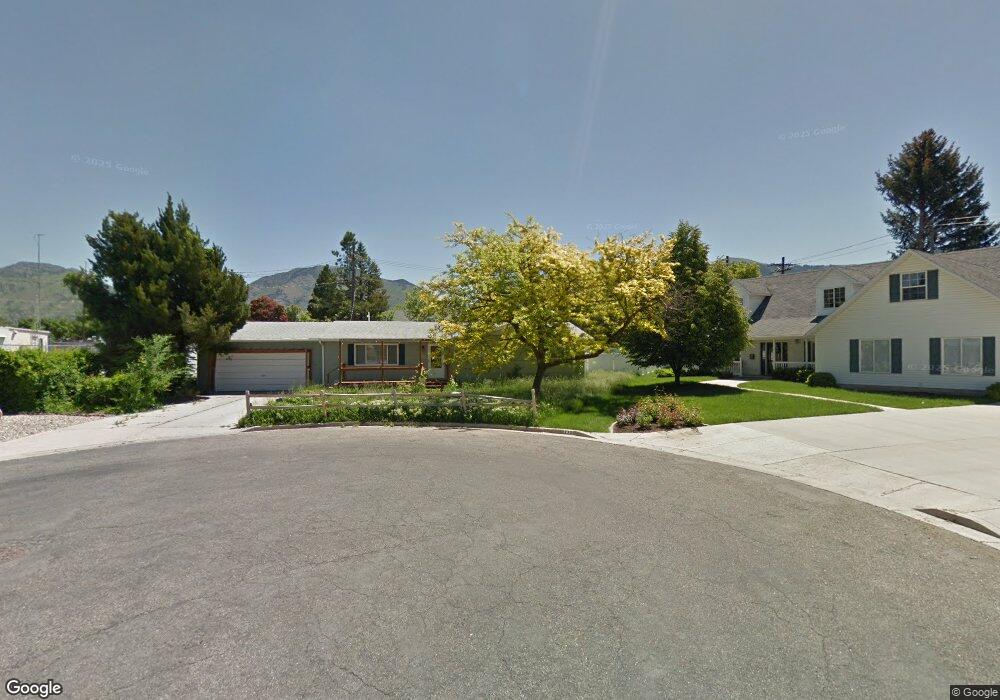
280 E 970 N Logan, UT 84321
Adams NeighborhoodEstimated Value: $372,000 - $403,000
3
Beds
2
Baths
1,414
Sq Ft
$273/Sq Ft
Est. Value
About This Home
This home is located at 280 E 970 N, Logan, UT 84321 and is currently estimated at $385,672, approximately $272 per square foot. 280 E 970 N is a home located in Cache County with nearby schools including Adams Elementary School, Mount Logan Middle School, and Logan High School.
Ownership History
Date
Name
Owned For
Owner Type
Purchase Details
Closed on
Sep 14, 2018
Sold by
Olsen Jeffrey Allen
Bought by
Arellano Angel
Current Estimated Value
Home Financials for this Owner
Home Financials are based on the most recent Mortgage that was taken out on this home.
Original Mortgage
$202,730
Interest Rate
4.6%
Mortgage Type
New Conventional
Purchase Details
Closed on
Nov 5, 2009
Sold by
Grischkowsky Sandra Pauline
Bought by
Olsen Jeffrey Allen
Create a Home Valuation Report for This Property
The Home Valuation Report is an in-depth analysis detailing your home's value as well as a comparison with similar homes in the area
Home Values in the Area
Average Home Value in this Area
Purchase History
| Date | Buyer | Sale Price | Title Company |
|---|---|---|---|
| Arellano Angel | -- | American Secure Title Logan | |
| Olsen Jeffrey Allen | -- | Northern Title Company |
Source: Public Records
Mortgage History
| Date | Status | Borrower | Loan Amount |
|---|---|---|---|
| Previous Owner | Arellano Angel | $202,730 |
Source: Public Records
Tax History
| Year | Tax Paid | Tax Assessment Tax Assessment Total Assessment is a certain percentage of the fair market value that is determined by local assessors to be the total taxable value of land and additions on the property. | Land | Improvement |
|---|---|---|---|---|
| 2025 | $1,568 | $202,850 | $0 | $0 |
| 2024 | $1,619 | $202,850 | $0 | $0 |
| 2023 | $1,689 | $201,640 | $0 | $0 |
| 2022 | $1,809 | $201,640 | $0 | $0 |
| 2021 | $1,407 | $242,400 | $45,000 | $197,400 |
| 2020 | $1,351 | $209,500 | $45,000 | $164,500 |
| 2019 | $1,219 | $180,860 | $45,000 | $135,860 |
| 2018 | $1,182 | $160,136 | $45,000 | $115,136 |
| 2017 | $1,135 | $81,290 | $0 | $0 |
| 2016 | $1,177 | $76,890 | $0 | $0 |
| 2015 | $1,115 | $76,890 | $0 | $0 |
| 2014 | $921 | $70,290 | $0 | $0 |
| 2013 | -- | $70,290 | $0 | $0 |
Source: Public Records
Map
Nearby Homes
Your Personal Tour Guide
Ask me questions while you tour the home.