Estimated Value: $218,000 - $323,000
Studio
--
Bath
1,407
Sq Ft
$183/Sq Ft
Est. Value
About This Home
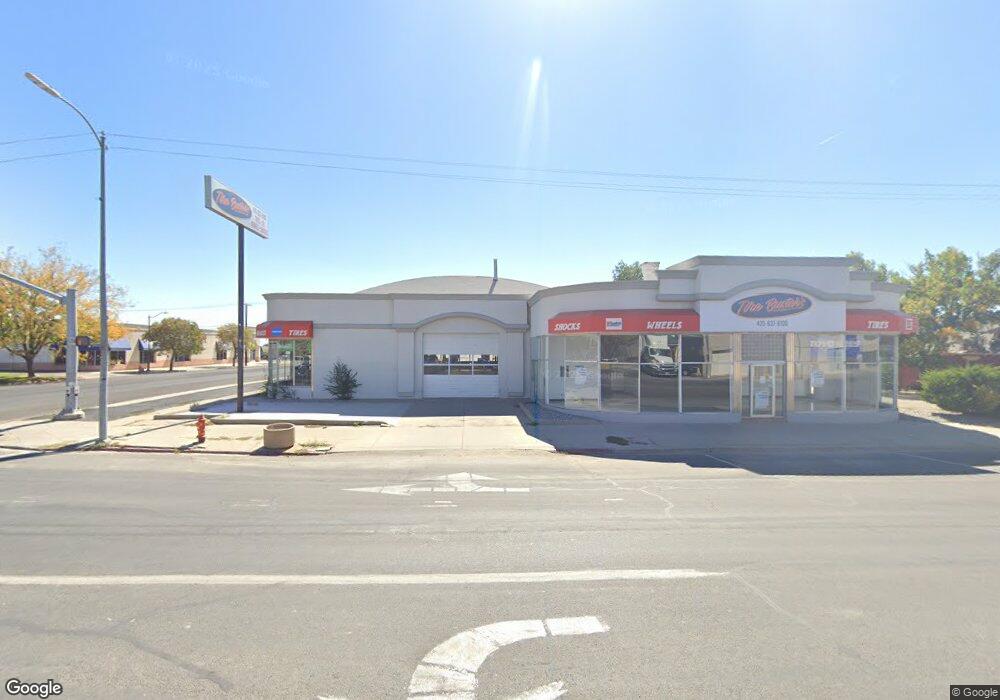
This home is located at 280 E Main St, Price, UT 84501 and is currently estimated at $258,000, approximately $183 per square foot. 280 E Main St is a home located in Carbon County with nearby schools including Wellington School, Mont Harmon Junior High School, and Carbon High School.
Ownership History
Date
Name
Owned For
Owner Type
Purchase Details
Closed on
May 2, 2023
Sold by
Axelgard Brandon Earl and Axelgard Korie Renae
Bought by
Brankor Solutions Llc
Current Estimated Value
Home Financials for this Owner
Home Financials are based on the most recent Mortgage that was taken out on this home.
Original Mortgage
$198,000
Outstanding Balance
$192,101
Interest Rate
6.42%
Mortgage Type
New Conventional
Estimated Equity
$65,899
Purchase Details
Closed on
Oct 20, 2008
Sold by
Professional Title Services
Bought by
Grako Gary G and Grako Bobbie A
Purchase Details
Closed on
Mar 23, 2007
Sold by
Gary And Bobbie Grako Family Trust
Bought by
Brankor Solutions Llc
Home Financials for this Owner
Home Financials are based on the most recent Mortgage that was taken out on this home.
Original Mortgage
$250,000
Interest Rate
6.13%
Mortgage Type
New Conventional
Create a Home Valuation Report for This Property
The Home Valuation Report is an in-depth analysis detailing your home's value as well as a comparison with similar homes in the area
Purchase History
| Date | Buyer | Sale Price | Title Company |
|---|---|---|---|
| Brankor Solutions Llc | -- | Professional Title Services | |
| Axelgard Brandon Earl | -- | None Listed On Document | |
| Axelgard Brandon Earl | -- | None Listed On Document | |
| Grako Gary G | -- | Professional Title Services | |
| Brankor Solutions Llc | -- | Professional Title Services |
Source: Public Records
Mortgage History
| Date | Status | Borrower | Loan Amount |
|---|---|---|---|
| Open | Axelgard Brandon Earl | $198,000 | |
| Closed | Axelgard Brandon Earl | $198,000 | |
| Previous Owner | Brankor Solutions Llc | $250,000 |
Source: Public Records
Tax History
| Year | Tax Paid | Tax Assessment Tax Assessment Total Assessment is a certain percentage of the fair market value that is determined by local assessors to be the total taxable value of land and additions on the property. | Land | Improvement |
|---|---|---|---|---|
| 2025 | $812 | $66,865 | $21,465 | $45,400 |
| 2024 | $2,635 | $120,674 | $56,408 | $64,266 |
| 2023 | $2,555 | $124,784 | $40,622 | $84,162 |
| 2022 | $2,658 | $116,434 | $61,729 | $54,706 |
| 2021 | $2,306 | $156,814 | $83,136 | $73,678 |
| 2020 | $2,310 | $143,291 | $0 | $0 |
| 2019 | $2,202 | $143,291 | $0 | $0 |
| 2018 | $2,159 | $143,291 | $0 | $0 |
| 2017 | $2,132 | $143,291 | $0 | $0 |
| 2016 | $1,923 | $143,291 | $0 | $0 |
| 2015 | $1,923 | $143,291 | $0 | $0 |
| 2014 | $1,909 | $143,196 | $0 | $0 |
| 2013 | $1,928 | $143,196 | $0 | $0 |
Source: Public Records
Map
Nearby Homes
Your Personal Tour Guide
Ask me questions while you tour the home.