
Seller's Agent in 2025
Maura Lindsay
Windermere Corporate
(206) 979-8760
7 Total Sales
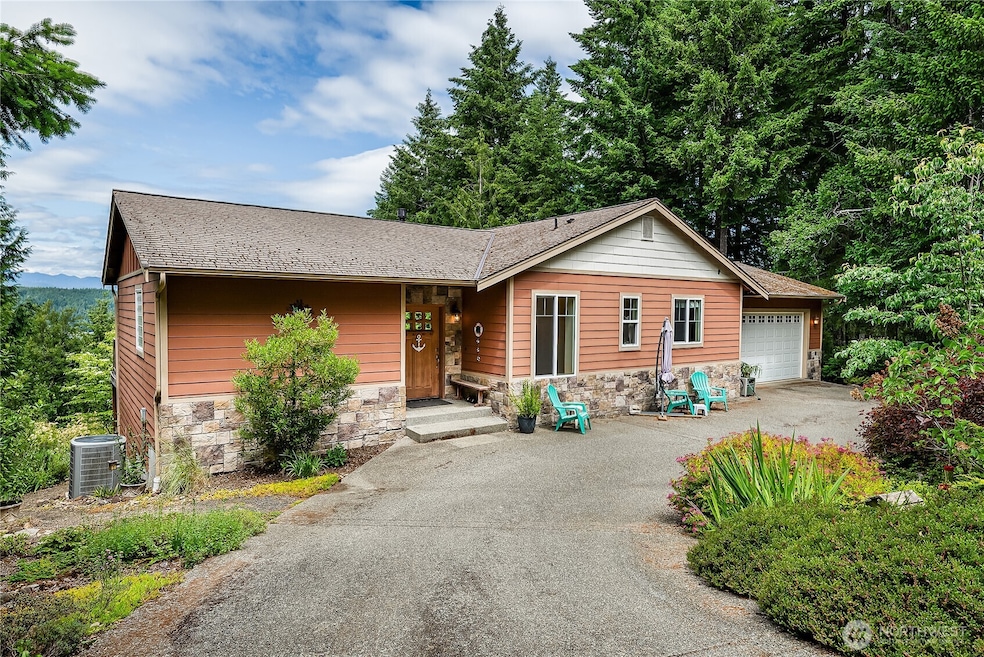
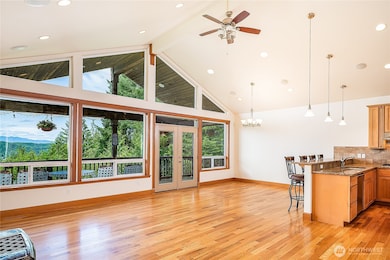
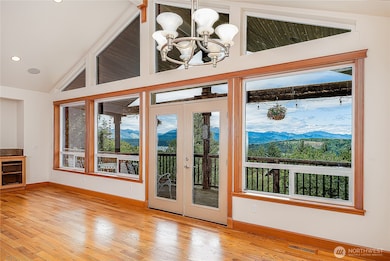
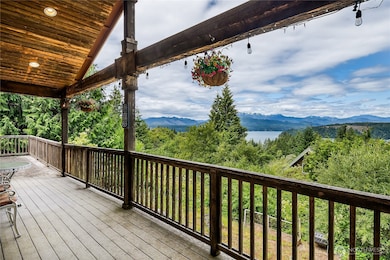
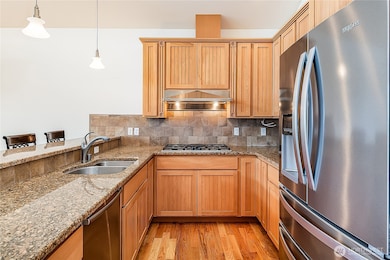
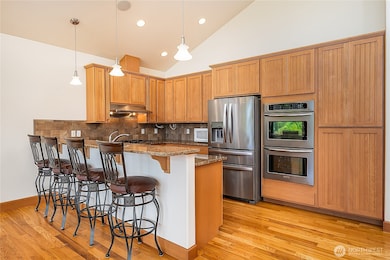
Come put your stamp on this Hood Canal oasis! Custom-built in 2006, a smart & versatile floor plan are perfect for entertaining or your own private retreat. Enter into Olympic Mountain and Canal views, framed by vaulted ceilings and gable windows. Open kitchen and dining lead out to large deck perfect for morning coffee or summer sunsets. Main-floor primary suite features a 5pc bath and a walk-in closet. Downstairs features sauna, wet bar, and second primary. Possible ADU? Quality craftsmanship is noticeable throughout with solid construction and timeless design. Minutes from Alderbrook Resort, Twanoh State Park, and all Hood Canal has to offer. Whole house generator for peace of mind. Don’t miss this tranquil home!
Last Agent to Sell the Property
Windermere Real Estate Co. License #23005966 Listed on: 06/20/2025
Source: Northwest Multiple Listing Service (NWMLS)
MLS#: 2393809
| Date | Type | Sale Price | Title Company |
|---|---|---|---|
| Warranty Deed | $566,300 | Horizon Title Group | |
| Bargain Sale Deed | $259,000 | First American Title | |
| Trustee Deed | $419,000 | First American Title | |
| Warranty Deed | $150,000 | Land Title Co |
| Date | Status | Loan Amount | Loan Type |
|---|---|---|---|
| Open | $493,000 | New Conventional | |
| Previous Owner | $190,000 | New Conventional | |
| Previous Owner | $130,000 | Purchase Money Mortgage |
| Date | Event | Price | List to Sale | Price per Sq Ft |
|---|---|---|---|---|
| 07/30/2025 07/30/25 | Sold | $566,300 | -5.5% | $208 / Sq Ft |
| 07/04/2025 07/04/25 | Pending | -- | -- | -- |
| 06/20/2025 06/20/25 | For Sale | $598,950 | -- | $220 / Sq Ft |
| Year | Tax Paid | Tax Assessment Tax Assessment Total Assessment is a certain percentage of the fair market value that is determined by local assessors to be the total taxable value of land and additions on the property. | Land | Improvement |
|---|---|---|---|---|
| 2025 | $4,428 | $685,605 | $128,770 | $556,835 |
| 2023 | $4,428 | $624,610 | $114,160 | $510,450 |
| 2022 | $4,246 | $463,545 | $71,350 | $392,195 |
| 2021 | $4,028 | $463,545 | $71,350 | $392,195 |
| 2020 | $930 | $392,910 | $69,275 | $323,635 |
| 2018 | $981 | $387,010 | $84,035 | $302,975 |
| 2017 | $1,020 | $387,125 | $84,150 | $302,975 |
| 2016 | $1,024 | $339,740 | $76,285 | $263,455 |
| 2015 | $3,388 | $344,650 | $78,645 | $266,005 |
| 2014 | -- | $342,100 | $78,645 | $263,455 |
| 2013 | -- | $333,720 | $55,100 | $278,620 |
Seller's Agent in 2025
Maura Lindsay
Windermere Corporate
(206) 979-8760
7 Total Sales
Buyer's Agent in 2025
Missy Watts
Olympic Sotheby's Int'l Realty
(360) 280-0509
174 Total Sales
Source: Northwest Multiple Listing Service (NWMLS)
MLS Number: 2393809
APN: 32232-52-20017
Disclaimer: Certain information contained herein is derived from information provided by parties other than Homes.com. All information provided is deemed reliable, but is not guaranteed to be accurate and should be independently verified.
![]() All data is obtained from various sources and may not have been verified by broker or MLS GRID. Supplied Open House Information is subject to change without notice. All information should be independently reviewed and verified for accuracy. Properties may or may not be listed by the office/agent presenting the information. Listing information is provided by the Northwest Multiple Listing Service (NWMLS). Property information is based on available data that may include MLS information, county records, and other sources. Listings marked with the 3 tree icon and provided by NWMLS. All properties are subject to prior sale or withdrawal. IDX information is provided exclusively for consumers’ personal noncommercial use, that it may not be used for any purpose other than to identify prospective properties consumers may be interested in purchasing, that the data is deemed reliable but is not guaranteed by MLS GRID. ©2026 NWMLS.
All data is obtained from various sources and may not have been verified by broker or MLS GRID. Supplied Open House Information is subject to change without notice. All information should be independently reviewed and verified for accuracy. Properties may or may not be listed by the office/agent presenting the information. Listing information is provided by the Northwest Multiple Listing Service (NWMLS). Property information is based on available data that may include MLS information, county records, and other sources. Listings marked with the 3 tree icon and provided by NWMLS. All properties are subject to prior sale or withdrawal. IDX information is provided exclusively for consumers’ personal noncommercial use, that it may not be used for any purpose other than to identify prospective properties consumers may be interested in purchasing, that the data is deemed reliable but is not guaranteed by MLS GRID. ©2026 NWMLS.
Based on information submitted to the MLS GRID
Ask me questions while you tour the home.