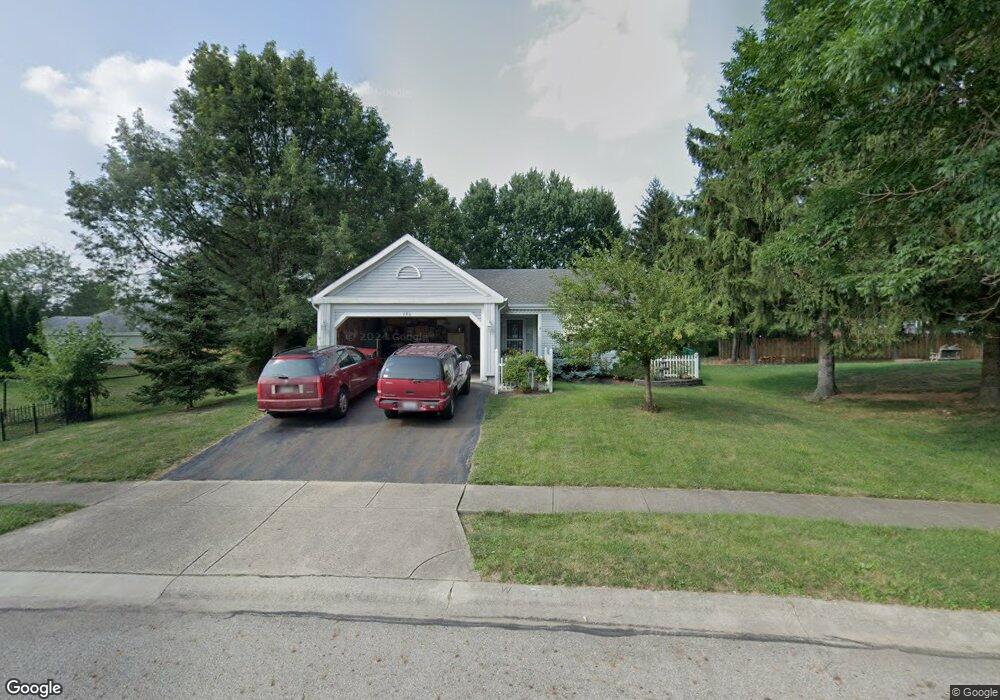
280 Evening Way Pickerington, OH 43147
Estimated Value: $280,468 - $313,000
3
Beds
2
Baths
1,148
Sq Ft
$257/Sq Ft
Est. Value
About This Home
This home is located at 280 Evening Way, Pickerington, OH 43147 and is currently estimated at $294,617, approximately $256 per square foot. 280 Evening Way is a home located in Fairfield County with nearby schools including Heritage Elementary School, Pickerington Ridgeview Junior High School, and Toll Gate Middle School.
Ownership History
Date
Name
Owned For
Owner Type
Purchase Details
Closed on
Dec 16, 1996
Sold by
Young William L
Bought by
Timura Thomas E and Timura Dianne T
Current Estimated Value
Home Financials for this Owner
Home Financials are based on the most recent Mortgage that was taken out on this home.
Original Mortgage
$104,156
Outstanding Balance
$7,971
Interest Rate
7.85%
Mortgage Type
FHA
Estimated Equity
$286,646
Purchase Details
Closed on
Mar 27, 1996
Sold by
Harmon Rhonda J
Bought by
Young William L and Young Jennifer L
Home Financials for this Owner
Home Financials are based on the most recent Mortgage that was taken out on this home.
Original Mortgage
$83,200
Interest Rate
6.5%
Mortgage Type
New Conventional
Purchase Details
Closed on
Oct 5, 1993
Sold by
Hammond Robb L
Bought by
Harman Rhonda J
Purchase Details
Closed on
Oct 1, 1987
Purchase Details
Closed on
Jun 1, 1987
Create a Home Valuation Report for This Property
The Home Valuation Report is an in-depth analysis detailing your home's value as well as a comparison with similar homes in the area
Home Values in the Area
Average Home Value in this Area
Purchase History
| Date | Buyer | Sale Price | Title Company |
|---|---|---|---|
| Timura Thomas E | $105,000 | -- | |
| Young William L | $104,000 | -- | |
| Harman Rhonda J | $94,000 | -- | |
| -- | $79,100 | -- | |
| -- | $130,000 | -- |
Source: Public Records
Mortgage History
| Date | Status | Borrower | Loan Amount |
|---|---|---|---|
| Open | Timura Thomas E | $104,156 | |
| Previous Owner | Young William L | $83,200 |
Source: Public Records
Tax History
| Year | Tax Paid | Tax Assessment Tax Assessment Total Assessment is a certain percentage of the fair market value that is determined by local assessors to be the total taxable value of land and additions on the property. | Land | Improvement |
|---|---|---|---|---|
| 2025 | $7,760 | $98,070 | $31,560 | $66,510 |
| 2024 | $7,760 | $63,040 | $14,490 | $48,550 |
| 2023 | $2,540 | $63,040 | $14,490 | $48,550 |
| 2022 | $2,568 | $63,040 | $14,490 | $48,550 |
| 2021 | $2,327 | $50,640 | $14,490 | $36,150 |
| 2020 | $2,352 | $50,640 | $14,490 | $36,150 |
| 2019 | $2,367 | $50,640 | $14,490 | $36,150 |
| 2018 | $2,348 | $40,940 | $13,200 | $27,740 |
| 2017 | $2,351 | $44,970 | $13,280 | $31,690 |
| 2016 | $2,339 | $44,970 | $13,280 | $31,690 |
| 2015 | $2,113 | $39,680 | $10,630 | $29,050 |
| 2014 | $2,087 | $39,680 | $10,630 | $29,050 |
| 2013 | $2,087 | $39,680 | $10,630 | $29,050 |
Source: Public Records
Map
Nearby Homes
- 93 Peggy Green Ln Unit 793
- 500 Meadows Blvd
- 748 Wharncliff Loop
- 205 Arlington Dr
- 0 W Columbus St Unit 5152884
- 0 W Columbus St Unit 225032912
- 477 Courtland Ln
- 266 Arlington Dr
- 115 Hill Rd S
- 495 Courtland Ln
- 368 Colony Park Dr
- 6448 Bemington Trai
- 292 Maple Place
- 237 Lockville Rd
- 11295 Pickerington Rd NW
- 11681 Village Way Dr
- 430 E Columbus St
- 559 Cherry Hill Dr
- 170 Bristo St
- 692 Hill Rd N
- 250 Evening Way
- 320 Evening Way
- 342 Evening Way
- 230 Evening Way
- 388 Meadows Blvd
- 354 Evening Way
- 376 Meadows Blvd
- 372 Meadows Blvd
- 200 Evening Way
- 370 Meadows Blvd
- 283 Evening Way
- 269 Evening Way
- 295 Evening Way
- 213 Evening Way
- 255 Evening Way
- 335 Evening Way
- 343 Evening Way
- 201 Evening Way
- 355 Evening Way
- 327 Evening Way
Your Personal Tour Guide
Ask me questions while you tour the home.