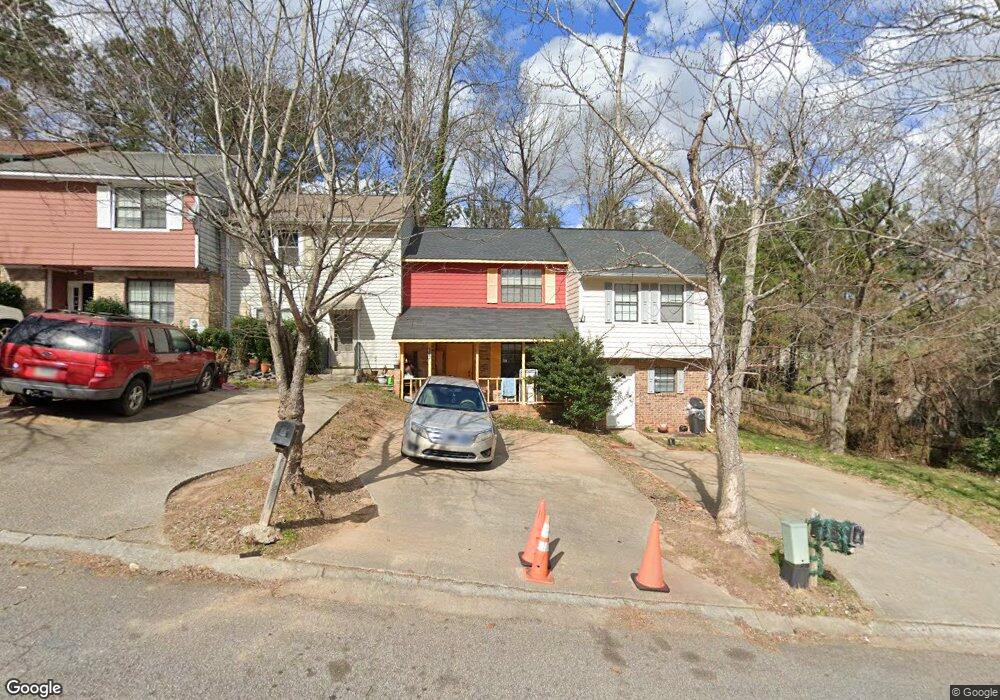
280 Flagstone Way Austell, GA 30168
Estimated Value: $128,000 - $162,000
2
Beds
3
Baths
990
Sq Ft
$142/Sq Ft
Est. Value
About This Home
This home is located at 280 Flagstone Way, Austell, GA 30168 and is currently estimated at $140,139, approximately $141 per square foot. 280 Flagstone Way is a home located in Cobb County with nearby schools including Riverside Primary School, Lindley Middle School, and Pebblebrook High School.
Ownership History
Date
Name
Owned For
Owner Type
Purchase Details
Closed on
Jun 18, 2024
Sold by
Portales Amado Reyes and Reyes Amado
Bought by
Gonzalez Javier and Gonzalez Lizbeth
Current Estimated Value
Home Financials for this Owner
Home Financials are based on the most recent Mortgage that was taken out on this home.
Original Mortgage
$75,300
Outstanding Balance
$43,795
Interest Rate
7.09%
Mortgage Type
New Conventional
Estimated Equity
$96,344
Purchase Details
Closed on
Dec 1, 2009
Sold by
Branch Bkng & Trust Co
Bought by
Hud-Housing Of Urban Dev
Purchase Details
Closed on
Jan 18, 2002
Sold by
Mcintosh Henry F and Mcintosh Patricia A
Bought by
Sharpe Earl G
Home Financials for this Owner
Home Financials are based on the most recent Mortgage that was taken out on this home.
Original Mortgage
$74,333
Interest Rate
7.12%
Mortgage Type
FHA
Create a Home Valuation Report for This Property
The Home Valuation Report is an in-depth analysis detailing your home's value as well as a comparison with similar homes in the area
Home Values in the Area
Average Home Value in this Area
Purchase History
| Date | Buyer | Sale Price | Title Company |
|---|---|---|---|
| Gonzalez Javier | $102,500 | None Listed On Document | |
| Hud-Housing Of Urban Dev | -- | -- | |
| Branch Banking & Trust Co | $75,706 | -- | |
| Sharpe Earl G | $75,500 | -- |
Source: Public Records
Mortgage History
| Date | Status | Borrower | Loan Amount |
|---|---|---|---|
| Open | Gonzalez Javier | $75,300 | |
| Previous Owner | Sharpe Earl G | $74,333 |
Source: Public Records
Tax History Compared to Growth
Tax History
| Year | Tax Paid | Tax Assessment Tax Assessment Total Assessment is a certain percentage of the fair market value that is determined by local assessors to be the total taxable value of land and additions on the property. | Land | Improvement |
|---|---|---|---|---|
| 2025 | $1,687 | $56,000 | $12,000 | $44,000 |
| 2024 | $1,558 | $51,684 | $12,000 | $39,684 |
| 2023 | $1,247 | $41,356 | $6,000 | $35,356 |
| 2022 | $1,255 | $41,356 | $6,000 | $35,356 |
| 2021 | $821 | $27,056 | $4,000 | $23,056 |
| 2020 | $821 | $27,056 | $4,000 | $23,056 |
| 2019 | $883 | $29,092 | $4,000 | $25,092 |
| 2018 | $471 | $15,508 | $4,000 | $11,508 |
| 2017 | $446 | $15,508 | $4,000 | $11,508 |
| 2016 | $366 | $12,724 | $3,200 | $9,524 |
| 2015 | $375 | $12,724 | $3,200 | $9,524 |
| 2014 | $307 | $10,344 | $0 | $0 |
Source: Public Records
Map
Nearby Homes
- 7224 Kings Cove Unit 10
- 295 Sweetshrub Dr Unit 2
- 7080 Fringe Flower Dr Unit 18
- 7074 Oakhill Cir
- 7066 Oakhill Cir
- 201 Wilhelmina Dr
- 7010 Oakhill Cir
- 0 Cityview Dr SW Unit 10597603
- 306 Bonnes Dr
- 7282 Rockhouse Rd Unit 5
- 6914 Fairway Trail
- 338 Alderman Trace
- 6837 Shenandoah Trail
- 203 Silver Arrow Cir
- 6874 Bridgewood Dr
- 7249 Factory Shoals Rd
- 218 Copperbend Dr
- 6854 Bridgewood Dr
- 6941 Gallant Cir SE Unit 10
- 6947 Gallant Cir SE Unit 10
- 282 Flagstone Way
- 284 Flagstone Way Unit 1
- 286 Flagstone Way
- 286 Flagstone Way Unit 286
- 288 Flagstone Way
- 290 Flagstone Way Unit 1
- 292 Flagstone Way
- 283 Sweetshrub Dr Unit 12
- 283 Sweetshrub Dr
- 287 Sweetshrub Dr Unit 11
- 287 Sweetshrub Dr Unit 2
- 279 Sweetshrub Dr Unit 13
- 291 Sweetshrub Dr Unit 10
- 275 Sweetshrub Dr Unit 14
- 283 Flagstone Way Unit 1
- 295 Sweetshrub Dr Unit 9
- 294 Flagstone Way Unit 1
- 294 Flagstone Way Unit 11
- 281 Flagstone Way
- 279 Flagstone Way Unit 1