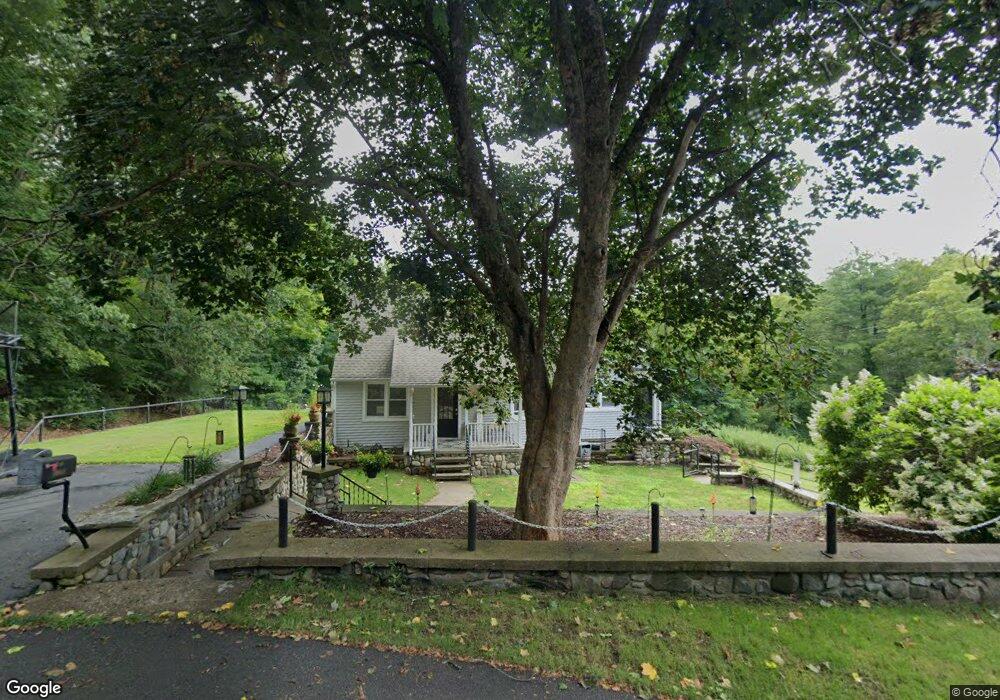
280 James St Ludlow, MA 01056
Estimated Value: $358,529 - $369,000
4
Beds
1
Bath
1,450
Sq Ft
$251/Sq Ft
Est. Value
About This Home
This home is located at 280 James St, Ludlow, MA 01056 and is currently estimated at $364,632, approximately $251 per square foot. 280 James St is a home located in Hampden County with nearby schools including East Street Elementary School, Chapin Street Elementary School, and Paul R. Baird Middle School.
Ownership History
Date
Name
Owned For
Owner Type
Purchase Details
Closed on
Aug 6, 2009
Sold by
Czech Sylvia and Cyranowski Sylvia
Bought by
Smola Daniel C
Current Estimated Value
Purchase Details
Closed on
Jul 14, 2009
Sold by
Greene Teresa and Cyranowski-Morse Teresa
Bought by
Cyranowski-Dalessio Carol and Cyranowski Michael
Create a Home Valuation Report for This Property
The Home Valuation Report is an in-depth analysis detailing your home's value as well as a comparison with similar homes in the area
Home Values in the Area
Average Home Value in this Area
Purchase History
| Date | Buyer | Sale Price | Title Company |
|---|---|---|---|
| Smola Daniel C | $170,000 | -- | |
| Smola Daniel C | $170,000 | -- | |
| Cyranowski-Dalessio Carol | -- | -- | |
| Cyranowski-Dalessio Carol | -- | -- |
Source: Public Records
Mortgage History
| Date | Status | Borrower | Loan Amount |
|---|---|---|---|
| Open | Cyranowski-Dalessio Carol | $125,000 |
Source: Public Records
Tax History
| Year | Tax Paid | Tax Assessment Tax Assessment Total Assessment is a certain percentage of the fair market value that is determined by local assessors to be the total taxable value of land and additions on the property. | Land | Improvement |
|---|---|---|---|---|
| 2025 | $4,695 | $270,600 | $92,000 | $178,600 |
| 2024 | $4,551 | $251,600 | $92,000 | $159,600 |
| 2023 | $4,187 | $214,600 | $76,500 | $138,100 |
| 2022 | $3,994 | $199,800 | $76,500 | $123,300 |
| 2021 | $4,012 | $190,300 | $76,500 | $113,800 |
| 2020 | $3,846 | $186,500 | $75,300 | $111,200 |
| 2019 | $3,595 | $181,400 | $74,600 | $106,800 |
| 2018 | $3,530 | $185,700 | $82,900 | $102,800 |
| 2017 | $3,332 | $179,800 | $80,400 | $99,400 |
| 2016 | $3,325 | $183,400 | $87,600 | $95,800 |
| 2015 | $3,152 | $182,300 | $86,700 | $95,600 |
Source: Public Records
Map
Nearby Homes
- 143 James St
- 1172 East St
- Lot 28 Tower Rd
- 22 Balsam Hill Rd
- 308 Miller St Unit 79
- 308 Miller St Unit 78
- 308 Miller St Unit 6
- Lot 88 Turning Leaf Equinox Pass
- 429 Moore St
- 44 Balsam Hill Rd
- 229 Miller St Unit F-13
- 229 Miller St Unit C-1
- 229 Miller St Unit G-3
- 37 Balsam Hill Rd
- 80 Elizabeth Dr
- 30 Red Bridge Rd Land Lot 3
- 30 Red Bridge Rd Land Lot 1
- 30 Red Bridge Rd Land Lot 6
- 30 Red Bridge Rd Land Lot 8
- 30 Red Bridge Rd Land Lot 4
- 264 James St
- 259 James St
- 242 James St
- 235 James St
- 149 Poole St
- 137 Poole St
- 68 Deponte Dr
- 125 Poole St
- 167 Poole St
- 219 James St
- 220 James St
- 177 Poole St
- 115 Poole St
- 189 Poole St
- 0 Deponte Dr L:95s Unit 72978800
- 0 Deponte Dr L:95s Unit 72809321
- 0 Deponte Dr L:95s
- 156 Poole St
- 213 Poole St
- 203 James St
Your Personal Tour Guide
Ask me questions while you tour the home.