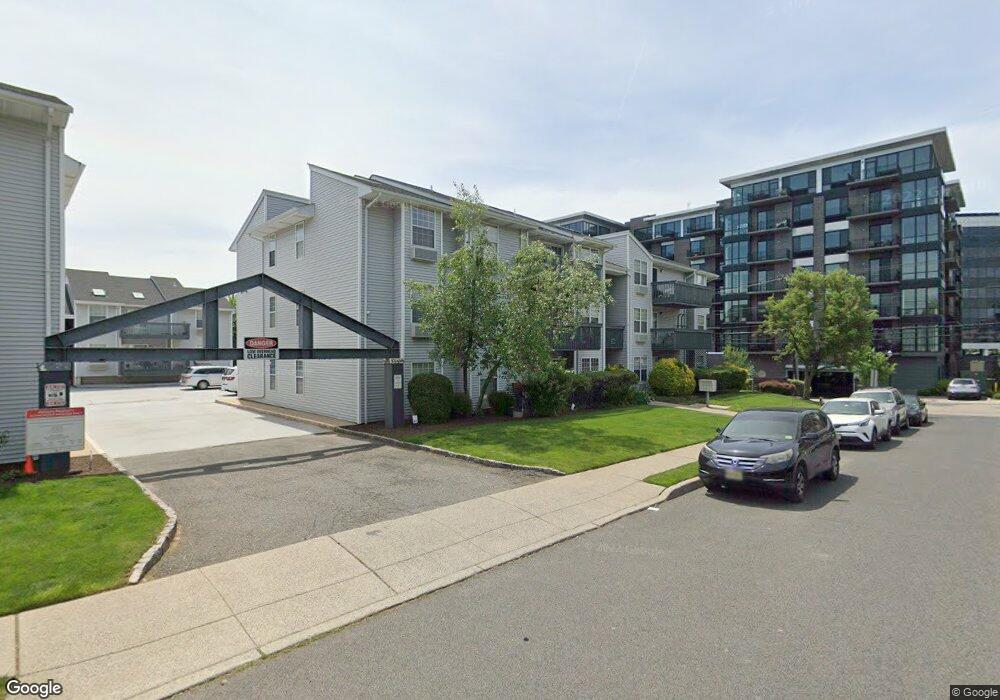
280 Kipp St Hackensack, NJ 07601
Estimated Value: $413,000 - $431,000
--
Bed
--
Bath
1,040
Sq Ft
$405/Sq Ft
Est. Value
About This Home
This home is located at 280 Kipp St, Hackensack, NJ 07601 and is currently estimated at $421,060, approximately $404 per square foot. 280 Kipp St is a home located in Bergen County with nearby schools including Hackensack High School, Corpus Christi School, and George Washington School.
Ownership History
Date
Name
Owned For
Owner Type
Purchase Details
Closed on
May 8, 2025
Sold by
Sinisi Matthew F and Sinisi Marilyn
Bought by
Echeverry Rosemarie and Echeverry Gerardo
Current Estimated Value
Home Financials for this Owner
Home Financials are based on the most recent Mortgage that was taken out on this home.
Original Mortgage
$373,500
Outstanding Balance
$372,223
Interest Rate
6.83%
Mortgage Type
New Conventional
Estimated Equity
$48,837
Purchase Details
Closed on
Jan 19, 2009
Sold by
Sinisi Matthew F
Bought by
Sinisi Matthew F and Sinisi Marilyn
Purchase Details
Closed on
Mar 31, 2006
Sold by
Englert James
Bought by
Sinisi Matthew
Home Financials for this Owner
Home Financials are based on the most recent Mortgage that was taken out on this home.
Original Mortgage
$227,000
Interest Rate
6.26%
Purchase Details
Closed on
Jun 14, 2002
Sold by
Carcich John
Bought by
Guskind Marilyn
Purchase Details
Closed on
Dec 13, 2000
Sold by
Schultz Harvey
Bought by
Englert James W and Englert Wendy J Guskind
Home Financials for this Owner
Home Financials are based on the most recent Mortgage that was taken out on this home.
Original Mortgage
$106,400
Interest Rate
7.69%
Create a Home Valuation Report for This Property
The Home Valuation Report is an in-depth analysis detailing your home's value as well as a comparison with similar homes in the area
Home Values in the Area
Average Home Value in this Area
Purchase History
| Date | Buyer | Sale Price | Title Company |
|---|---|---|---|
| Echeverry Rosemarie | $415,000 | Stewart Title | |
| Echeverry Rosemarie | $415,000 | Stewart Title | |
| Sinisi Matthew F | -- | -- | |
| Sinisi Matthew | $297,000 | -- | |
| Guskind Marilyn | $138,000 | -- | |
| Englert James W | $133,000 | -- |
Source: Public Records
Mortgage History
| Date | Status | Borrower | Loan Amount |
|---|---|---|---|
| Open | Echeverry Rosemarie | $373,500 | |
| Closed | Echeverry Rosemarie | $373,500 | |
| Previous Owner | Sinisi Matthew | $227,000 | |
| Previous Owner | Englert James W | $106,400 |
Source: Public Records
Tax History Compared to Growth
Tax History
| Year | Tax Paid | Tax Assessment Tax Assessment Total Assessment is a certain percentage of the fair market value that is determined by local assessors to be the total taxable value of land and additions on the property. | Land | Improvement |
|---|---|---|---|---|
| 2025 | $8,542 | $279,500 | $112,500 | $167,000 |
| 2024 | $8,047 | $279,500 | $112,500 | $167,000 |
| 2023 | $7,750 | $279,500 | $112,500 | $167,000 |
| 2022 | $7,750 | $276,600 | $110,000 | $166,600 |
| 2021 | $7,673 | $228,500 | $99,500 | $129,000 |
| 2020 | $7,561 | $228,500 | $99,500 | $129,000 |
| 2019 | $7,553 | $225,000 | $97,500 | $127,500 |
| 2018 | $7,649 | $224,100 | $97,000 | $127,100 |
| 2017 | $7,537 | $220,700 | $95,000 | $125,700 |
| 2016 | $7,067 | $209,200 | $85,000 | $124,200 |
| 2015 | $8,155 | $233,000 | $76,900 | $156,100 |
| 2014 | $7,740 | $233,000 | $76,900 | $156,100 |
Source: Public Records
Map
Nearby Homes
- 279 Clark St Unit A-7
- 229 Baldwin Ave
- 163 Kent St
- 513 Boulevard
- 115 Polifly Rd Unit 4F
- 14 James Ct
- 460 Boulevard
- 378 Marvin Ave
- 146 Hobart St
- 54 Polifly Rd Unit 309
- 300 Garibaldi Ave
- 140 Prospect St
- 240 Essex St
- 363 Kaplan Ave
- 75 Cleveland St
- 448 Sutton Ave
- 102 Charlton Ave
- 100 Charlton Ave
- 72 Charlton Ave
- 115 Kansas St
- 280 Kipp St
- 280 Kipp St
- 280 Kipp St
- 280 Kipp St
- 280 Kipp St
- 280 Kipp St
- 280 Kipp St Unit C001A
- 280 Kipp St Unit 1C
- 280 Kipp St
- 280 Kipp St
- 280 Kipp St
- 280 Kipp St
- 280 Kipp St
- 280 Kipp St Unit 1B
- 280 Kipp St Unit 3 B-C
- 280 Kipp St Unit 2C
- 280 Kipp St Unit 2B
- 280 Kipp St Unit 3A
- 280 Kipp St Unit 2A
- 272 Kipp St Unit 4J