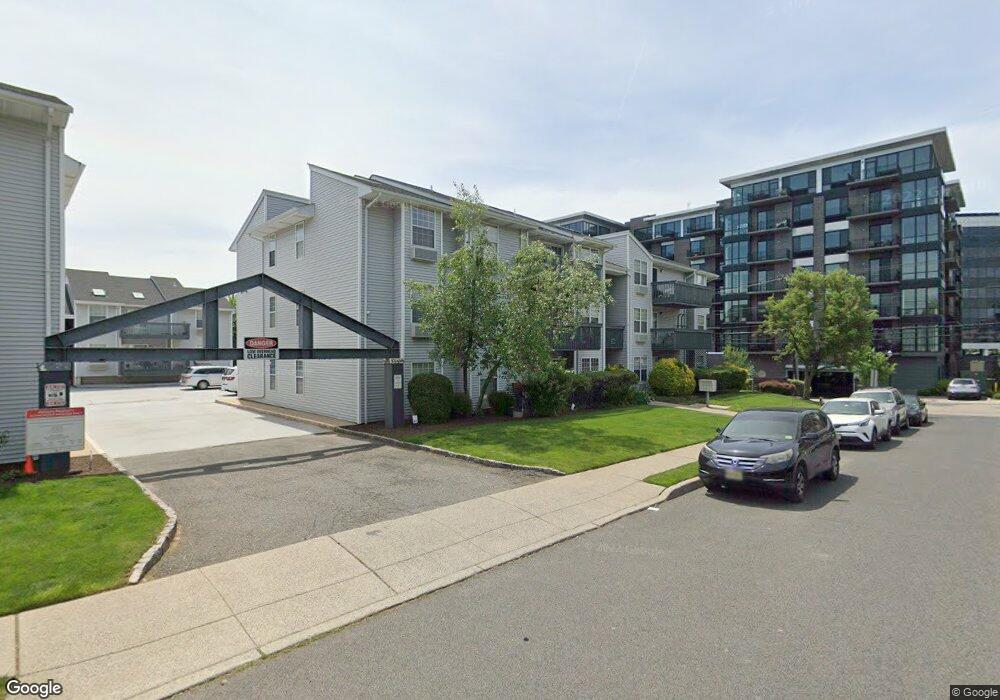
280 Kipp St Hackensack, NJ 07601
Estimated Value: $324,000 - $336,324
Studio
--
Bath
770
Sq Ft
$427/Sq Ft
Est. Value
About This Home
This home is located at 280 Kipp St, Hackensack, NJ 07601 and is currently estimated at $329,081, approximately $427 per square foot. 280 Kipp St is a home located in Bergen County with nearby schools including Hackensack High School, Corpus Christi School, and George Washington School.
Ownership History
Date
Name
Owned For
Owner Type
Purchase Details
Closed on
Sep 9, 2019
Sold by
Bright Benjamin
Bought by
Nunno Nicole C
Current Estimated Value
Home Financials for this Owner
Home Financials are based on the most recent Mortgage that was taken out on this home.
Original Mortgage
$194,000
Interest Rate
3.5%
Mortgage Type
New Conventional
Purchase Details
Closed on
Jul 31, 2009
Sold by
271 Valley Boulevard Associates Llc
Bought by
Bright Benjamin
Home Financials for this Owner
Home Financials are based on the most recent Mortgage that was taken out on this home.
Original Mortgage
$215,523
Interest Rate
5.47%
Mortgage Type
Purchase Money Mortgage
Purchase Details
Closed on
Mar 10, 2005
Sold by
Macaluso Richard
Bought by
271 Valley Blvd Assoc Llc
Create a Home Valuation Report for This Property
The Home Valuation Report is an in-depth analysis detailing your home's value as well as a comparison with similar homes in the area
Home Values in the Area
Average Home Value in this Area
Purchase History
| Date | Buyer | Sale Price | Title Company |
|---|---|---|---|
| Nunno Nicole C | $200,000 | Chicago Title | |
| Bright Benjamin | $219,500 | -- | |
| 271 Valley Blvd Assoc Llc | $225,000 | -- |
Source: Public Records
Mortgage History
| Date | Status | Borrower | Loan Amount |
|---|---|---|---|
| Previous Owner | Nunno Nicole C | $194,000 | |
| Previous Owner | Bright Benjamin | $215,523 |
Source: Public Records
Tax History Compared to Growth
Tax History
| Year | Tax Paid | Tax Assessment Tax Assessment Total Assessment is a certain percentage of the fair market value that is determined by local assessors to be the total taxable value of land and additions on the property. | Land | Improvement |
|---|---|---|---|---|
| 2025 | $6,580 | $215,300 | $112,500 | $102,800 |
| 2024 | $6,198 | $215,300 | $112,500 | $102,800 |
| 2023 | $5,957 | $215,300 | $112,500 | $102,800 |
| 2022 | $5,957 | $212,600 | $110,000 | $102,600 |
| 2021 | $6,098 | $181,600 | $99,500 | $82,100 |
| 2020 | $6,009 | $181,600 | $99,500 | $82,100 |
| 2019 | $5,996 | $178,600 | $97,500 | $81,100 |
| 2018 | $6,068 | $177,800 | $97,000 | $80,800 |
| 2017 | $5,969 | $174,800 | $95,000 | $79,800 |
| 2016 | $5,533 | $163,800 | $85,000 | $78,800 |
| 2015 | $6,255 | $178,700 | $59,000 | $119,700 |
| 2014 | $5,936 | $178,700 | $59,000 | $119,700 |
Source: Public Records
Map
Nearby Homes
- 279 Clark St Unit A-7
- 229 Baldwin Ave
- 163 Kent St
- 115 Polifly Rd Unit 4F
- 14 James Ct
- 460 Boulevard
- 378 Marvin Ave
- 54 Polifly Rd Unit 309
- 300 Garibaldi Ave
- 140 Prospect St
- 240 Essex St
- 252 Church St
- 75 Cleveland St
- 448 Sutton Ave
- 102 Charlton Ave
- 100 Charlton Ave
- 309 Ottawa Ave
- 72 Charlton Ave
- 115 Kansas St
- 113 Kansas St
- 280 Kipp St
- 280 Kipp St
- 280 Kipp St
- 280 Kipp St
- 280 Kipp St
- 280 Kipp St
- 280 Kipp St Unit C001A
- 280 Kipp St Unit 1C
- 280 Kipp St
- 280 Kipp St
- 280 Kipp St
- 280 Kipp St
- 280 Kipp St
- 280 Kipp St Unit 1B
- 280 Kipp St Unit 3 B-C
- 280 Kipp St Unit 2C
- 280 Kipp St Unit 2B
- 280 Kipp St Unit 3A
- 280 Kipp St Unit 2A
- 272 Kipp St Unit 4J