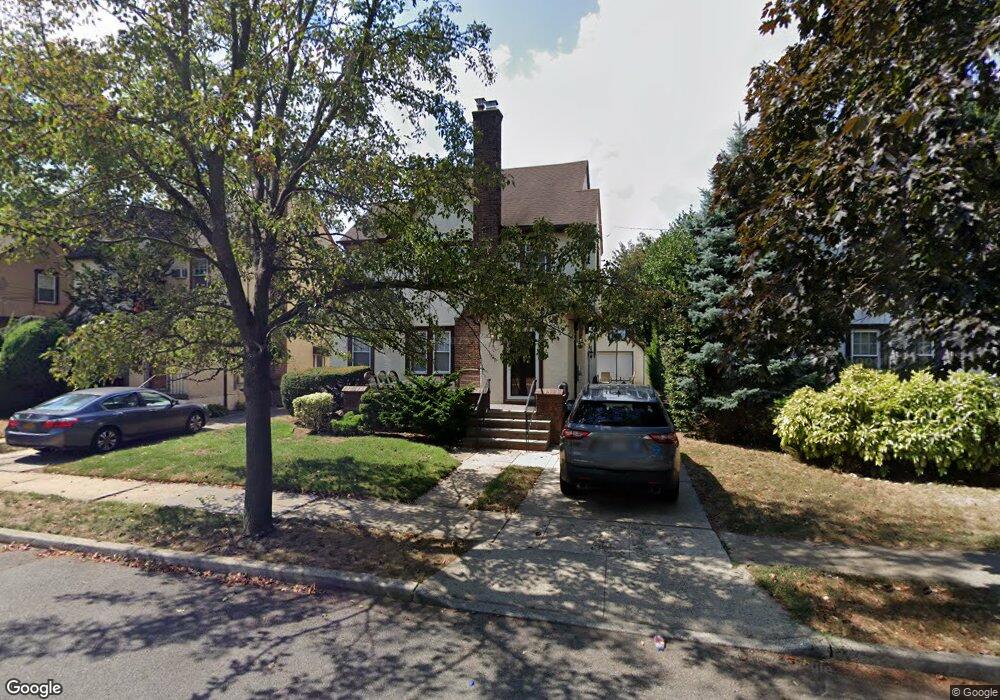
280 Lindberg St West Hempstead, NY 11552
Estimated Value: $710,000 - $727,533
--
Bed
2
Baths
1,866
Sq Ft
$385/Sq Ft
Est. Value
About This Home
This home is located at 280 Lindberg St, West Hempstead, NY 11552 and is currently estimated at $718,767, approximately $385 per square foot. 280 Lindberg St is a home located in Nassau County with nearby schools including Chestnut Street School, West Hempstead Middle School, and West Hempstead Secondary School.
Ownership History
Date
Name
Owned For
Owner Type
Purchase Details
Closed on
Jun 10, 2010
Sold by
Mccomb Shannon C
Bought by
Horowitz Ira E and Horowitz Dawn M
Current Estimated Value
Home Financials for this Owner
Home Financials are based on the most recent Mortgage that was taken out on this home.
Original Mortgage
$332,000
Outstanding Balance
$222,616
Interest Rate
4.98%
Mortgage Type
Purchase Money Mortgage
Estimated Equity
$496,151
Purchase Details
Closed on
Aug 23, 2007
Sold by
Dreher Barbara
Bought by
Mccomb Shannon
Purchase Details
Closed on
May 26, 2000
Create a Home Valuation Report for This Property
The Home Valuation Report is an in-depth analysis detailing your home's value as well as a comparison with similar homes in the area
Home Values in the Area
Average Home Value in this Area
Purchase History
| Date | Buyer | Sale Price | Title Company |
|---|---|---|---|
| Horowitz Ira E | $415,000 | -- | |
| Mccomb Shannon | $370,000 | -- | |
| -- | -- | -- |
Source: Public Records
Mortgage History
| Date | Status | Borrower | Loan Amount |
|---|---|---|---|
| Open | Horowitz Ira E | $332,000 |
Source: Public Records
Tax History Compared to Growth
Tax History
| Year | Tax Paid | Tax Assessment Tax Assessment Total Assessment is a certain percentage of the fair market value that is determined by local assessors to be the total taxable value of land and additions on the property. | Land | Improvement |
|---|---|---|---|---|
| 2025 | $14,885 | $553 | $220 | $333 |
| 2024 | $4,994 | $553 | $220 | $333 |
| 2023 | $13,134 | $553 | $220 | $333 |
| 2022 | $13,134 | $553 | $220 | $333 |
| 2021 | $17,113 | $528 | $210 | $318 |
| 2020 | $12,351 | $706 | $495 | $211 |
| 2019 | $11,709 | $706 | $495 | $211 |
| 2018 | $10,914 | $706 | $0 | $0 |
| 2017 | $6,628 | $750 | $402 | $348 |
| 2016 | $10,374 | $923 | $495 | $428 |
| 2015 | $4,299 | $923 | $495 | $428 |
| 2014 | $4,299 | $923 | $495 | $428 |
| 2013 | $4,025 | $923 | $495 | $428 |
Source: Public Records
Map
Nearby Homes