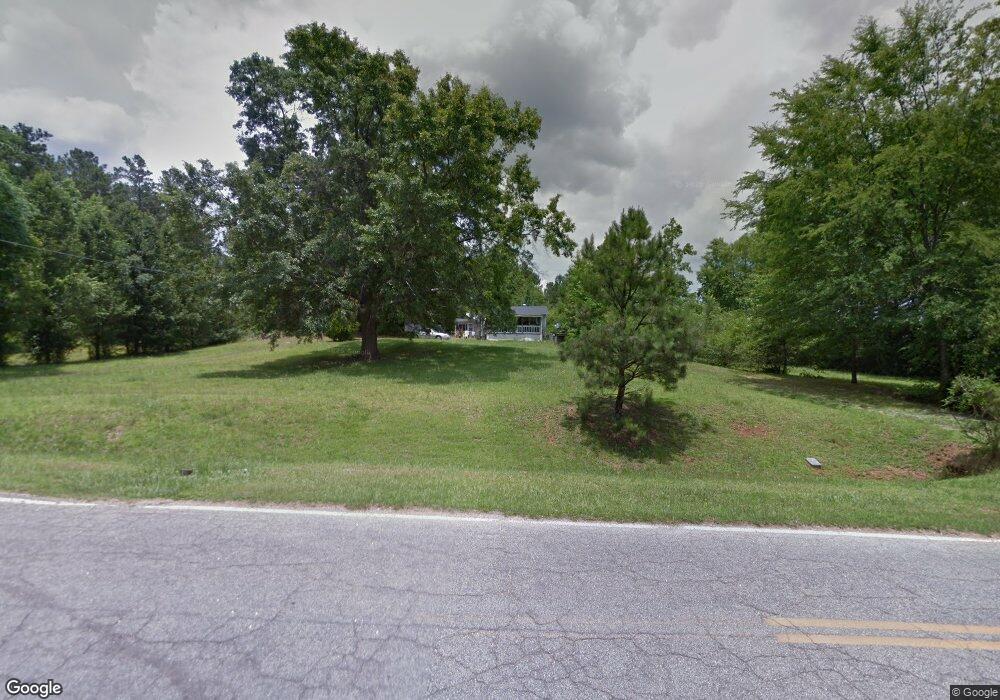
280 Lowry Rd Grantville, GA 30220
Estimated Value: $110,319 - $188,000
3
Beds
1
Bath
806
Sq Ft
$168/Sq Ft
Est. Value
About This Home
This home is located at 280 Lowry Rd, Grantville, GA 30220 and is currently estimated at $135,080, approximately $167 per square foot. 280 Lowry Rd is a home located in Coweta County with nearby schools including Moreland Elementary School, Smokey Road Middle School, and Newnan High School.
Ownership History
Date
Name
Owned For
Owner Type
Purchase Details
Closed on
Jun 9, 2006
Sold by
Trivia Ents Inc
Bought by
Thomas Candice M
Current Estimated Value
Home Financials for this Owner
Home Financials are based on the most recent Mortgage that was taken out on this home.
Original Mortgage
$47,700
Outstanding Balance
$29,326
Interest Rate
7.5%
Mortgage Type
New Conventional
Estimated Equity
$105,754
Purchase Details
Closed on
Mar 31, 2006
Sold by
Trivia Enterprises Inc
Bought by
Trivia Enterprises Inc
Purchase Details
Closed on
Feb 23, 2006
Sold by
Fields Barbara Ann
Bought by
Trivia Enterprises Inc
Purchase Details
Closed on
Dec 30, 1994
Bought by
Fields Alvin Lawrenc
Purchase Details
Closed on
Nov 21, 1990
Bought by
Fields Frances Lurle
Purchase Details
Closed on
May 31, 1988
Bought by
Fields Lurlean Barbe
Create a Home Valuation Report for This Property
The Home Valuation Report is an in-depth analysis detailing your home's value as well as a comparison with similar homes in the area
Home Values in the Area
Average Home Value in this Area
Purchase History
| Date | Buyer | Sale Price | Title Company |
|---|---|---|---|
| Thomas Candice M | $53,000 | -- | |
| Trivia Enterprises Inc | -- | -- | |
| Trivia Enterprises Inc | $35,000 | -- | |
| Fields Alvin Lawrenc | -- | -- | |
| Fields Frances Lurle | -- | -- | |
| Fields Lurlean Barbe | -- | -- |
Source: Public Records
Mortgage History
| Date | Status | Borrower | Loan Amount |
|---|---|---|---|
| Open | Thomas Candice M | $47,700 |
Source: Public Records
Tax History Compared to Growth
Tax History
| Year | Tax Paid | Tax Assessment Tax Assessment Total Assessment is a certain percentage of the fair market value that is determined by local assessors to be the total taxable value of land and additions on the property. | Land | Improvement |
|---|---|---|---|---|
| 2025 | $644 | $22,369 | $7,037 | $15,332 |
| 2024 | $644 | $22,646 | $7,037 | $15,609 |
| 2023 | $644 | $25,166 | $9,585 | $15,580 |
| 2022 | $471 | $16,180 | $3,449 | $12,731 |
| 2021 | $492 | $15,391 | $3,284 | $12,107 |
| 2020 | $500 | $15,391 | $3,284 | $12,107 |
| 2019 | $554 | $15,343 | $7,332 | $8,011 |
| 2018 | $541 | $15,343 | $7,332 | $8,011 |
| 2017 | $597 | $16,900 | $7,332 | $9,568 |
| 2016 | $598 | $16,900 | $7,332 | $9,568 |
| 2015 | $320 | $10,303 | $4,888 | $5,415 |
| 2014 | $320 | $10,303 | $4,888 | $5,415 |
Source: Public Records
Map
Nearby Homes
- 110 Meadowbrook Ln
- 121 Meadowbrook Ln
- 17 Saint Charles Place
- 125 S Meadows Ridge Dr
- 0 Highway 29 Rd
- 4282 S Highway 29
- 161 Brasch Park Dr
- 485 Polk Rd
- 0 Highway 0029 Unit 10619140
- 1302 Allen Rd
- 5710 Hwy 29
- LOT 1 Haynes Rd
- 244 Deer Creek Run Unit LOT 17
- 296 Deer Creek Run Unit LOT 11
- 230 Haynes Rd
- 93.49 ACRES Forrest Rd
- 0 Deer Creek Run Unit LOT 1 10590875
- 110 Lone Oak St
- 108 Lone Oak St
- 936 Bo Banks Rd
- 102 Meadowbrook Ln
- 104 Meadowbrook Ln
- 106 Meadowbrook Ln
- 186 Classic Rd
- 270 Lowry Rd
- 20 Meadow Run
- 101 Meadowbrook Ln
- 30 Meadow Run
- 103 Meadowbrook Ln
- 0 Meadow Run Unit 3164128
- 102 Jenny Rd
- 191 Classic Rd
- 0 Meadowbrook Ln Unit 8465410
- 0 Meadowbrook Ln Unit 8394117
- 0 Meadowbrook Ln Unit 7293074
- 0 Meadowbrook Ln Unit 7015233
- 0 Meadowbrook Ln Unit 7061169
- 0 Meadowbrook Ln Unit 7099150
- 0 Meadowbrook Ln Unit 7175925
- 0 Meadowbrook Ln Unit 7224697