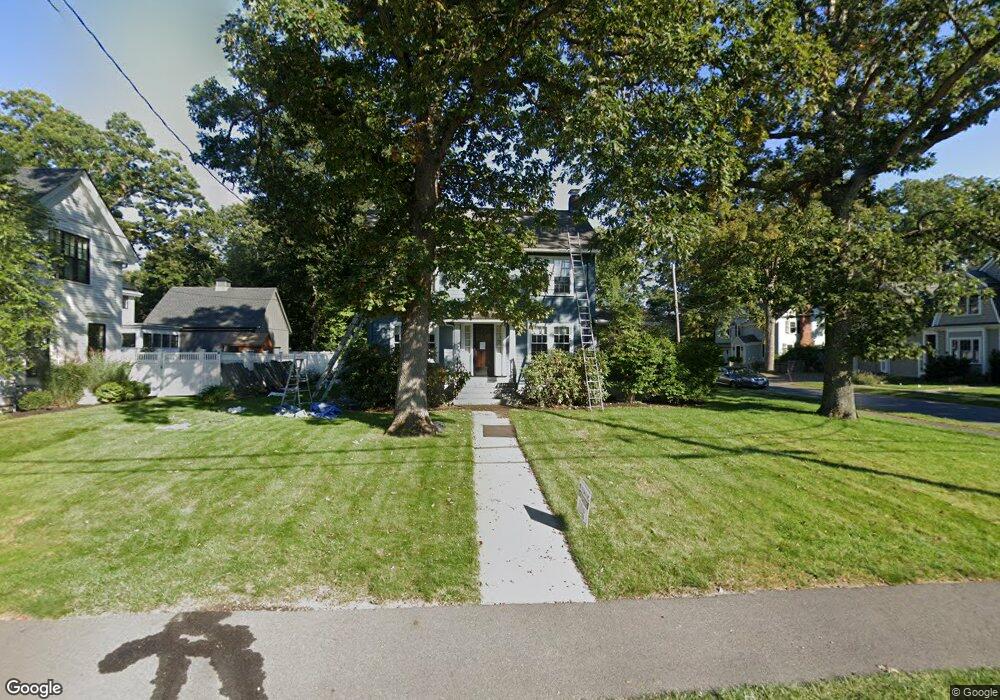
280 Manning St Needham, MA 02492
Estimated Value: $1,192,000 - $1,760,000
4
Beds
3
Baths
1,078
Sq Ft
$1,401/Sq Ft
Est. Value
About This Home
This home is located at 280 Manning St, Needham, MA 02492 and is currently estimated at $1,510,549, approximately $1,401 per square foot. 280 Manning St is a home located in Norfolk County with nearby schools including Mitchell Elementary School, High Rock Middle School, and Pollard Middle School.
Ownership History
Date
Name
Owned For
Owner Type
Purchase Details
Closed on
Jun 30, 2017
Sold by
Tyler William C and Levesque Claire A
Bought by
Manning Street 280 Rt
Current Estimated Value
Purchase Details
Closed on
Mar 24, 1994
Sold by
Roshfeld Larry M and Roshfeld Laurie B
Bought by
Tyler William C
Home Financials for this Owner
Home Financials are based on the most recent Mortgage that was taken out on this home.
Original Mortgage
$290,000
Interest Rate
7.15%
Mortgage Type
Purchase Money Mortgage
Purchase Details
Closed on
Aug 1, 1991
Sold by
Dephillippo Samuel and Dephillippo Arlene
Bought by
Roshfeld Larry M and Roshfeld Laurie B
Create a Home Valuation Report for This Property
The Home Valuation Report is an in-depth analysis detailing your home's value as well as a comparison with similar homes in the area
Home Values in the Area
Average Home Value in this Area
Purchase History
| Date | Buyer | Sale Price | Title Company |
|---|---|---|---|
| Manning Street 280 Rt | -- | -- | |
| Tyler William C | $362,500 | -- | |
| Roshfeld Larry M | $320,000 | -- |
Source: Public Records
Mortgage History
| Date | Status | Borrower | Loan Amount |
|---|---|---|---|
| Previous Owner | Roshfeld Larry M | $150,000 | |
| Previous Owner | Roshfeld Larry M | $123,000 | |
| Previous Owner | Roshfeld Larry M | $290,000 | |
| Previous Owner | Roshfeld Larry M | $114,000 |
Source: Public Records
Tax History
| Year | Tax Paid | Tax Assessment Tax Assessment Total Assessment is a certain percentage of the fair market value that is determined by local assessors to be the total taxable value of land and additions on the property. | Land | Improvement |
|---|---|---|---|---|
| 2025 | $13,186 | $1,244,000 | $802,500 | $441,500 |
| 2024 | $12,252 | $978,600 | $582,700 | $395,900 |
| 2023 | $12,387 | $949,900 | $582,700 | $367,200 |
| 2022 | $11,943 | $893,300 | $539,700 | $353,600 |
| 2021 | $11,640 | $893,300 | $539,700 | $353,600 |
| 2020 | $11,400 | $912,700 | $539,700 | $373,000 |
| 2019 | $10,596 | $855,200 | $490,800 | $364,400 |
| 2018 | $10,160 | $855,200 | $490,800 | $364,400 |
| 2017 | $9,680 | $814,100 | $490,800 | $323,300 |
| 2016 | $9,395 | $814,100 | $490,800 | $323,300 |
| 2015 | $9,191 | $814,100 | $490,800 | $323,300 |
| 2014 | $8,619 | $740,500 | $427,000 | $313,500 |
Source: Public Records
Map
Nearby Homes
- 638 Webster St
- 638 Webster St Unit 638
- 36 Otis St Unit 36
- 190 Brookline St
- 19 Oakland Ave Unit 19
- 19 Highland Ct Unit 19
- 510 Webster St
- 17 Lindbergh Ave
- 100 Bradford St
- 58 Morton St
- 176 Highgate St
- 24 Mellen St
- 193 Garden St
- 31 Birds Hill Ave
- 68 Brookline St
- 233 Warren St
- 7 West St
- 126 Prince St
- 447 Hillside Ave
- 68 Pleasant St Unit 68
Your Personal Tour Guide
Ask me questions while you tour the home.