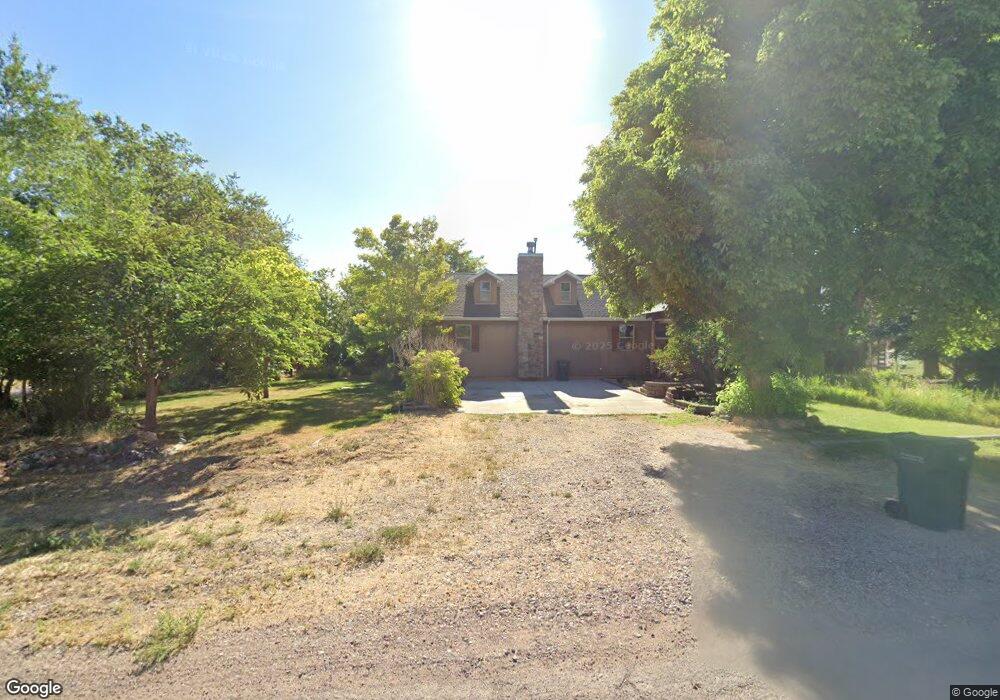
280 N 300 W Parowan, UT 84761
Estimated Value: $424,000 - $620,000
5
Beds
2
Baths
4,258
Sq Ft
$128/Sq Ft
Est. Value
About This Home
This home is located at 280 N 300 W, Parowan, UT 84761 and is currently estimated at $546,619, approximately $128 per square foot. 280 N 300 W is a home located in Iron County with nearby schools including Parowan School, Parowan High School, and Cedar City High School.
Ownership History
Date
Name
Owned For
Owner Type
Purchase Details
Closed on
Apr 26, 2024
Sold by
Clemmer Bruce and Clemmer Teresita
Bought by
Clemmer-Kasunic Partners Llc
Current Estimated Value
Purchase Details
Closed on
Sep 29, 2020
Sold by
Grimshaw Worth
Bought by
Clemmer Bruce and Clemmer Teresita
Home Financials for this Owner
Home Financials are based on the most recent Mortgage that was taken out on this home.
Original Mortgage
$422,688
Interest Rate
2.9%
Mortgage Type
VA
Create a Home Valuation Report for This Property
The Home Valuation Report is an in-depth analysis detailing your home's value as well as a comparison with similar homes in the area
Home Values in the Area
Average Home Value in this Area
Purchase History
| Date | Buyer | Sale Price | Title Company |
|---|---|---|---|
| Clemmer-Kasunic Partners Llc | -- | None Listed On Document | |
| Clemmer Bruce | -- | Southern Ut Ttl Co Of Cedar |
Source: Public Records
Mortgage History
| Date | Status | Borrower | Loan Amount |
|---|---|---|---|
| Previous Owner | Clemmer Bruce | $422,688 |
Source: Public Records
Tax History Compared to Growth
Tax History
| Year | Tax Paid | Tax Assessment Tax Assessment Total Assessment is a certain percentage of the fair market value that is determined by local assessors to be the total taxable value of land and additions on the property. | Land | Improvement |
|---|---|---|---|---|
| 2025 | $2,390 | $296,660 | $53,539 | $243,121 |
| 2023 | $2,160 | $281,845 | $47,805 | $234,040 |
| 2022 | $2,140 | $223,485 | $43,455 | $180,030 |
| 2021 | $1,984 | $207,190 | $27,160 | $180,030 |
| 2020 | $1,956 | $180,460 | $21,310 | $159,150 |
| 2019 | $1,952 | $171,900 | $21,310 | $150,590 |
| 2018 | $1,963 | $169,120 | $18,530 | $150,590 |
| 2017 | $1,781 | $149,665 | $18,530 | $131,135 |
| 2016 | $1,882 | $149,825 | $18,530 | $131,295 |
| 2015 | $1,857 | $139,660 | $0 | $0 |
| 2014 | $1,967 | $141,120 | $0 | $0 |
Source: Public Records
Map
Nearby Homes