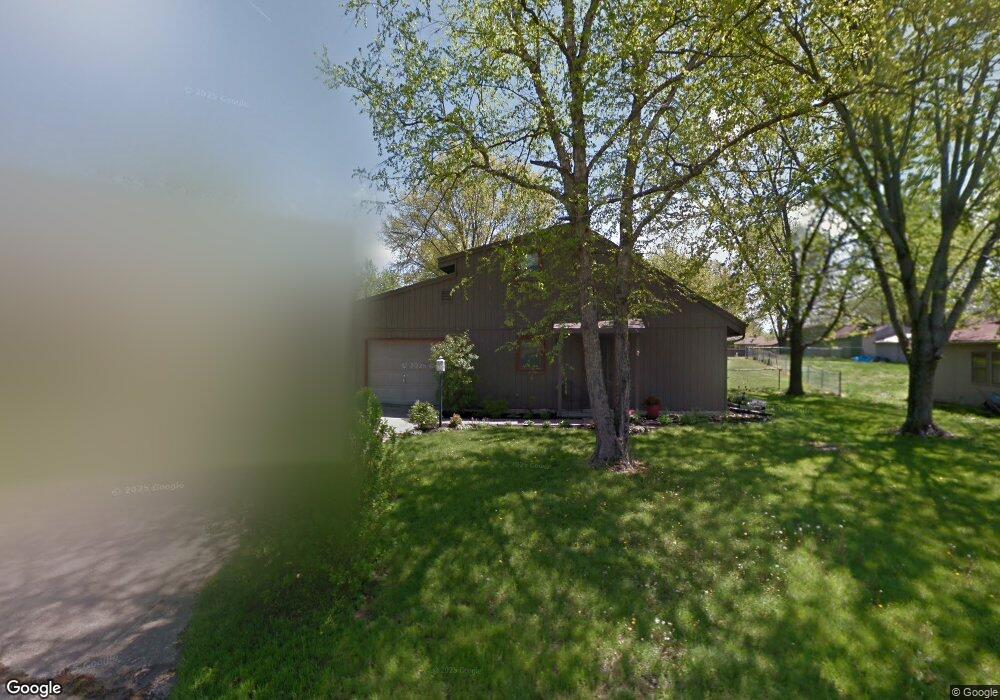
280 N Sunnyside Ct Columbia, MO 65201
Estimated Value: $225,000 - $264,000
3
Beds
2
Baths
1,337
Sq Ft
$179/Sq Ft
Est. Value
About This Home
This home is located at 280 N Sunnyside Ct, Columbia, MO 65201 and is currently estimated at $239,740, approximately $179 per square foot. 280 N Sunnyside Ct is a home located in Boone County with nearby schools including Shepard Boulevard Elementary School, Oakland Middle School, and Muriel W. Battle High School.
Ownership History
Date
Name
Owned For
Owner Type
Purchase Details
Closed on
Jan 6, 2021
Sold by
Harper Matthew C
Bought by
Bowen Caleb
Current Estimated Value
Home Financials for this Owner
Home Financials are based on the most recent Mortgage that was taken out on this home.
Original Mortgage
$151,404
Outstanding Balance
$135,105
Interest Rate
2.7%
Mortgage Type
VA
Estimated Equity
$104,635
Purchase Details
Closed on
Jun 4, 2015
Sold by
Heitmeyer Jana
Bought by
Harper Matthew C
Home Financials for this Owner
Home Financials are based on the most recent Mortgage that was taken out on this home.
Original Mortgage
$132,142
Interest Rate
3.82%
Mortgage Type
New Conventional
Purchase Details
Closed on
Nov 19, 2007
Sold by
Mcnutt James and Mcnutt Michelle
Bought by
Heitmeyer Jana
Home Financials for this Owner
Home Financials are based on the most recent Mortgage that was taken out on this home.
Original Mortgage
$123,500
Interest Rate
6.43%
Mortgage Type
New Conventional
Create a Home Valuation Report for This Property
The Home Valuation Report is an in-depth analysis detailing your home's value as well as a comparison with similar homes in the area
Home Values in the Area
Average Home Value in this Area
Purchase History
| Date | Buyer | Sale Price | Title Company |
|---|---|---|---|
| Bowen Caleb | -- | None Available | |
| Harper Matthew C | -- | -- | |
| Heitmeyer Jana | -- | None Available |
Source: Public Records
Mortgage History
| Date | Status | Borrower | Loan Amount |
|---|---|---|---|
| Open | Bowen Caleb | $151,404 | |
| Previous Owner | Harper Matthew C | $132,142 | |
| Previous Owner | Heitmeyer Jana | $123,500 |
Source: Public Records
Tax History Compared to Growth
Tax History
| Year | Tax Paid | Tax Assessment Tax Assessment Total Assessment is a certain percentage of the fair market value that is determined by local assessors to be the total taxable value of land and additions on the property. | Land | Improvement |
|---|---|---|---|---|
| 2025 | $1,683 | $25,612 | $3,078 | $22,534 |
| 2024 | $1,683 | $23,275 | $3,078 | $20,197 |
| 2023 | $1,669 | $23,275 | $3,078 | $20,197 |
| 2022 | $1,544 | $21,546 | $3,078 | $18,468 |
| 2021 | $1,546 | $21,546 | $3,078 | $18,468 |
| 2020 | $1,516 | $19,946 | $3,078 | $16,868 |
| 2019 | $1,517 | $19,946 | $3,078 | $16,868 |
| 2018 | $1,413 | $0 | $0 | $0 |
| 2017 | $1,397 | $18,468 | $3,078 | $15,390 |
| 2016 | $1,394 | $18,468 | $3,078 | $15,390 |
| 2015 | $1,288 | $18,468 | $3,078 | $15,390 |
| 2014 | $1,291 | $18,468 | $3,078 | $15,390 |
Source: Public Records
Map
Nearby Homes
- 360 N Sunny Side Ct
- 61 N Broadview Ct
- 235 N Luna Ln
- 25 N Luna Ln
- 60 N Luna Ln
- 9830 Interstate 70 Dr SE
- 841 NE Park Ln
- LOT 105 Portcrawl Dr
- LOT 104 Portcrawl Dr
- LOT 113 Portcrawl Dr
- LOT 114 Portcrawl Dr
- 6517 Portcrawl Dr
- LOT 119 Burnhill Dr
- LOT 117 Burnhill Dr
- LOT 125 Burnhill Dr
- 6504 Walsby Dr
- 6521 Cromford Ln
- LOT 149 Cromford Ln
- LOT 148 Cromford Ln
- LOT 146 Cromford Ln
- 280 N Sunny Side Ct
- 300 N Sunnyside Ct
- 300 N Sunny Side Ct
- 260 N Sunnyside Ct
- 260 N Sunny Side Ct
- 281 N Sunnyside Ct
- 241 N Sunnyside Ct
- 240 N Sunnyside Ct
- 241 N Sunny Side Ct
- 320 N Sunnyside Ct
- 241 N Rainbow Dr
- 281 N Sunny Side Ct
- 221 N Rainbow Dr
- 240 N Sunny Side Ct
- 301 N Sunnyside Ct
- 261 N Rainbow Dr
- 301 N Sunny Side Ct
- 201 N Rainbow Dr
- 340 N Sunny Side Ct
- 321 N Sunnyside Ct