280 NE Larson Blvd Belfair, WA 98528
Estimated Value: $397,000 - $435,000
3
Beds
3
Baths
1,409
Sq Ft
$297/Sq Ft
Est. Value
About This Home
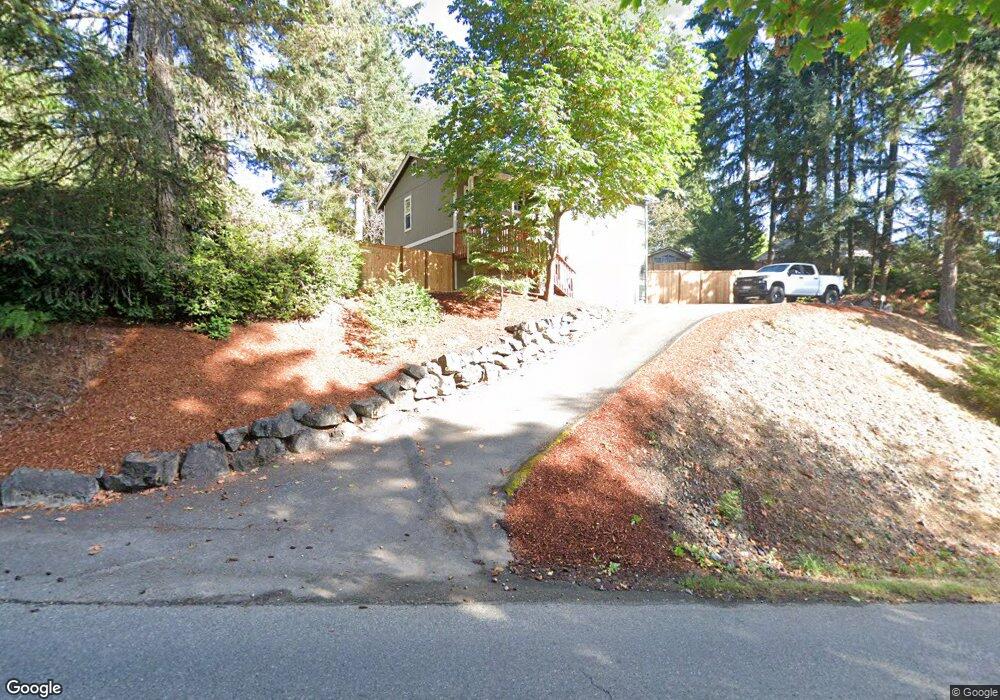
This home is located at 280 NE Larson Blvd, Belfair, WA 98528 and is currently estimated at $418,575, approximately $297 per square foot. 280 NE Larson Blvd is a home located in Mason County with nearby schools including North Mason Senior High School.
Ownership History
Date
Name
Owned For
Owner Type
Purchase Details
Closed on
Nov 20, 2014
Sold by
Federal Home Loan Mortgage Corporation
Bought by
Lucas Alexus M
Current Estimated Value
Home Financials for this Owner
Home Financials are based on the most recent Mortgage that was taken out on this home.
Original Mortgage
$158,100
Outstanding Balance
$121,555
Interest Rate
4.1%
Mortgage Type
New Conventional
Estimated Equity
$297,020
Purchase Details
Closed on
Jun 25, 2014
Sold by
Richardson John M and Richardson Tracey A
Bought by
Federal Home Loan Mortgage Corporation
Purchase Details
Closed on
Feb 4, 2008
Sold by
Miller Donna J
Bought by
Richardson John M and Richardson Tracey A
Home Financials for this Owner
Home Financials are based on the most recent Mortgage that was taken out on this home.
Original Mortgage
$199,999
Interest Rate
6.04%
Mortgage Type
New Conventional
Purchase Details
Closed on
Aug 25, 2005
Sold by
English Terrilee
Bought by
Miller Donna J
Create a Home Valuation Report for This Property
The Home Valuation Report is an in-depth analysis detailing your home's value as well as a comparison with similar homes in the area
Home Values in the Area
Average Home Value in this Area
Purchase History
| Date | Buyer | Sale Price | Title Company |
|---|---|---|---|
| Lucas Alexus M | -- | First American Title | |
| Federal Home Loan Mortgage Corporation | $277,982 | None Available | |
| Richardson John M | $199,998 | Mason County Title Ins Co | |
| Miller Donna J | $8,000 | First American Title Insuran |
Source: Public Records
Mortgage History
| Date | Status | Borrower | Loan Amount |
|---|---|---|---|
| Open | Lucas Alexus M | $158,100 | |
| Previous Owner | Richardson John M | $199,999 |
Source: Public Records
Tax History
| Year | Tax Paid | Tax Assessment Tax Assessment Total Assessment is a certain percentage of the fair market value that is determined by local assessors to be the total taxable value of land and additions on the property. | Land | Improvement |
|---|---|---|---|---|
| 2025 | $3,236 | $467,845 | $46,900 | $420,945 |
| 2023 | $3,236 | $408,245 | $26,800 | $381,445 |
| 2022 | $3,026 | $330,960 | $19,850 | $311,110 |
| 2021 | $3,023 | $330,960 | $19,850 | $311,110 |
| 2020 | $3,555 | $337,715 | $24,620 | $313,095 |
| 2018 | $2,884 | $248,165 | $23,450 | $224,715 |
| 2017 | $2,396 | $248,095 | $23,380 | $224,715 |
| 2016 | $2,378 | $210,810 | $19,780 | $191,030 |
| 2015 | $1,925 | $210,915 | $17,985 | $192,930 |
| 2014 | -- | $168,340 | $21,840 | $146,500 |
| 2013 | -- | $162,045 | $20,540 | $141,505 |
Source: Public Records
Map
Nearby Homes
- 31 NE Skipper Ct
- 11 NE Davey Jones Ct
- 81 NE Santa Maria Ln
- 111 NE Santa Maria Ln
- 741 NE Larson Blvd
- 20 NE Saber Dr
- 421 NE Cutlass Way
- 103 NE Belfair St
- 2 NE Old Belfair Hwy
- 150 NE State Route 300
- 301 NE West J Way
- 101 NE Wj Way
- 131 NE West J Way
- 221 NE West J Way
- 261 NE West J Way
- 200 NE West J Way
- 60 NE Lorrain Ct
- 25 NE Roy Boad Rd
- 541 NE Squire Ln
- 792 NE Old Belfair Hwy
- 290 NE Larson Blvd
- 141 NE Galley Way
- 151 NE Galley Way
- 261 NE Larson Blvd
- 300 NE Larson Blvd
- 111 NE Galley Way
- 251 NE Larson Blvd
- 70 NE Schooner Loop
- 241 NE Larson Blvd
- 281 NE Larson Blvd
- 81 NE Galley Way
- 291 NE Larson Blvd
- 60 NE Schooner Loop
- 140 NE Galley Way
- 291 NE Larson Blvd
- 0 LOT 93 NE Galley Way
- 160 NE Galley Way
- 30 NE Schooner Loop