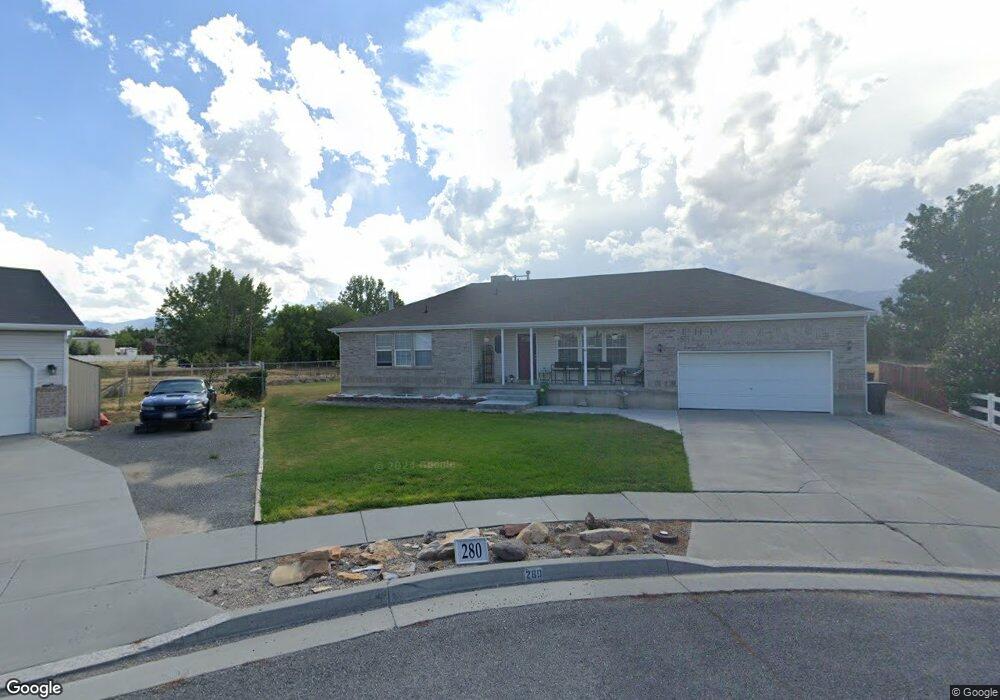
280 Orchard Cir Grantsville, UT 84029
Estimated Value: $453,000 - $589,000
--
Bed
--
Bath
2,812
Sq Ft
$178/Sq Ft
Est. Value
About This Home
This home is located at 280 Orchard Cir, Grantsville, UT 84029 and is currently estimated at $500,408, approximately $177 per square foot. 280 Orchard Cir is a home located in Tooele County with nearby schools including Willow Elementary School, Grantsville Junior High School, and Grantsville High School.
Ownership History
Date
Name
Owned For
Owner Type
Purchase Details
Closed on
Nov 16, 2012
Sold by
Palo John M and Palo Kathy Marie
Bought by
Palo John M and Palo Kathy Marie
Current Estimated Value
Home Financials for this Owner
Home Financials are based on the most recent Mortgage that was taken out on this home.
Original Mortgage
$163,420
Outstanding Balance
$112,605
Interest Rate
3.33%
Mortgage Type
VA
Estimated Equity
$387,803
Purchase Details
Closed on
Oct 29, 2009
Sold by
Palo John
Bought by
Palo John M and Palo Kathy Marie
Purchase Details
Closed on
Nov 19, 2007
Sold by
Palo John M and Palo Kathy M
Bought by
Palo John
Home Financials for this Owner
Home Financials are based on the most recent Mortgage that was taken out on this home.
Original Mortgage
$167,000
Interest Rate
6.38%
Mortgage Type
New Conventional
Purchase Details
Closed on
Oct 28, 2005
Sold by
Millward David C and Millward Amy L
Bought by
Palo John M and Palo Kathy M
Create a Home Valuation Report for This Property
The Home Valuation Report is an in-depth analysis detailing your home's value as well as a comparison with similar homes in the area
Home Values in the Area
Average Home Value in this Area
Purchase History
| Date | Buyer | Sale Price | Title Company |
|---|---|---|---|
| Palo John M | -- | None Available | |
| Palo John M | -- | None Available | |
| Palo John M | -- | None Available | |
| Palo John | -- | Guardian Title Company Of Ut | |
| Palo John | -- | Guardian Title Company Of Ut | |
| Palo John M | -- | First American Title Ins |
Source: Public Records
Mortgage History
| Date | Status | Borrower | Loan Amount |
|---|---|---|---|
| Open | Palo John M | $163,420 | |
| Previous Owner | Palo John | $167,000 |
Source: Public Records
Tax History Compared to Growth
Tax History
| Year | Tax Paid | Tax Assessment Tax Assessment Total Assessment is a certain percentage of the fair market value that is determined by local assessors to be the total taxable value of land and additions on the property. | Land | Improvement |
|---|---|---|---|---|
| 2025 | $2,757 | $254,073 | $44,000 | $210,073 |
| 2024 | $2,757 | $225,124 | $44,000 | $181,124 |
| 2023 | $2,757 | $228,465 | $41,800 | $186,665 |
| 2022 | $2,506 | $230,598 | $44,550 | $186,048 |
| 2021 | $2,128 | $159,725 | $33,688 | $126,037 |
| 2020 | $2,087 | $275,714 | $61,250 | $214,464 |
| 2019 | $2,143 | $276,617 | $35,000 | $241,617 |
| 2018 | $2,094 | $254,652 | $35,000 | $219,652 |
| 2017 | $1,691 | $218,043 | $35,000 | $183,043 |
| 2016 | $1,604 | $110,772 | $19,250 | $91,522 |
| 2015 | $1,604 | $110,772 | $0 | $0 |
| 2014 | -- | $83,739 | $0 | $0 |
Source: Public Records
Map
Nearby Homes
- 249 Haven Side Ct
- 231 Cherry St Unit 207
- 273 E Cherry St
- 232 E Cherry St
- 254 E Main St
- 241 S Quirk St Unit LOT 67
- 573 S Eyring Place
- 359 S Archwood Way Unit 617
- 132 Willow St
- 135 Willow St
- 256 E Durfee St
- 98 Mcmichael Ave
- 54 S Hale St
- 159 E North St
- 17 W Plum St
- Logan Plan at Springfield Estates
- Lily Plan at Springfield Estates
- Asher Plan at Springfield Estates
- Jordan Plan at Springfield Estates
- Kingston Craftsman Plan at Springfield Estates
- 286 Orchard Cir
- 281 Orchard Cir
- 249 Haven Side Ct Unit 15
- 245 E Haven Side Ct Unit 14
- 247 E Haven Side Ct Unit 14
- 285 Orchard Cir
- 247 Haven Side Ct
- 247 Haven Side Ct Unit 14
- 290 Orchard Cir
- 290 Orchard Cir
- 289 Orchard Cir
- 245 Haven Side Ct
- 243 Haven Side Ct
- 294 Orchard Cir
- 237 Country Haven Ln
- 100 Orchard Ln
- 239 Country Haven Ln
- 239 Country Haven Ln Unit 239
- 173 Country Ct
- 173 Country Ct