280 S 530 W Logan, UT 84321
Woodruff NeighborhoodEstimated Value: $511,536 - $578,000
--
Bed
--
Bath
2,232
Sq Ft
$245/Sq Ft
Est. Value
About This Home
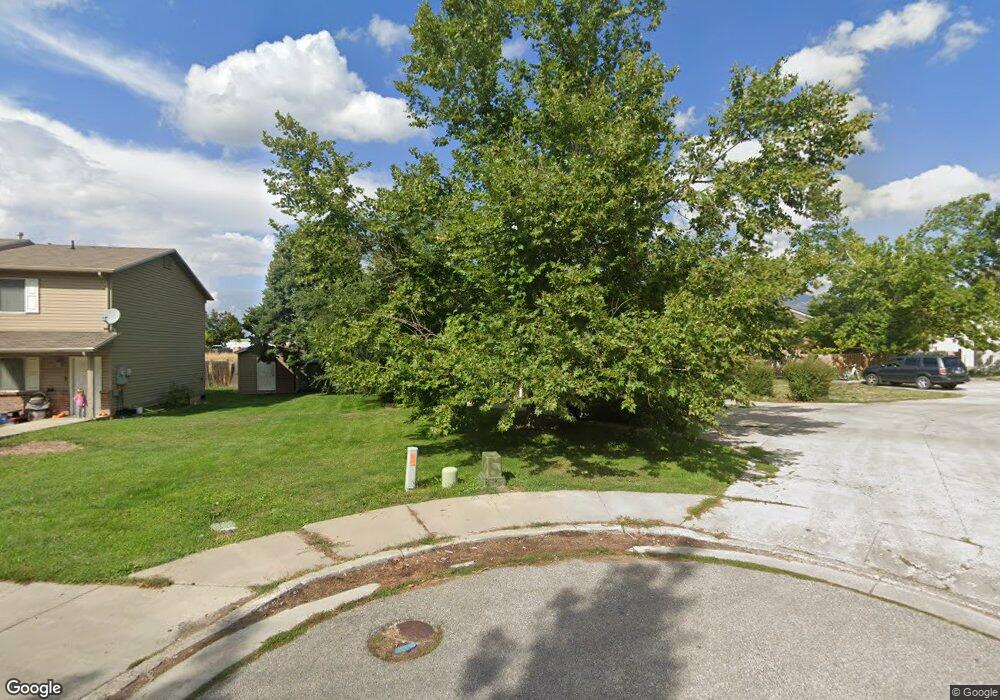
This home is located at 280 S 530 W, Logan, UT 84321 and is currently estimated at $545,884, approximately $244 per square foot. 280 S 530 W is a home with nearby schools including Woodruff School, Mount Logan Middle School, and Logan High School.
Ownership History
Date
Name
Owned For
Owner Type
Purchase Details
Closed on
Nov 3, 2006
Sold by
Barker Alan
Bought by
Barker Alan and Barker Megan
Current Estimated Value
Home Financials for this Owner
Home Financials are based on the most recent Mortgage that was taken out on this home.
Original Mortgage
$140,800
Outstanding Balance
$81,109
Interest Rate
5.75%
Mortgage Type
New Conventional
Estimated Equity
$464,775
Purchase Details
Closed on
Nov 3, 2005
Sold by
Welch Jenny and Welch Todd
Bought by
Barker Alan
Home Financials for this Owner
Home Financials are based on the most recent Mortgage that was taken out on this home.
Original Mortgage
$145,600
Interest Rate
1%
Mortgage Type
Negative Amortization
Purchase Details
Closed on
Aug 16, 2002
Sold by
Karren Development Llc
Bought by
Mark Higley Construction Lc
Create a Home Valuation Report for This Property
The Home Valuation Report is an in-depth analysis detailing your home's value as well as a comparison with similar homes in the area
Home Values in the Area
Average Home Value in this Area
Purchase History
| Date | Buyer | Sale Price | Title Company |
|---|---|---|---|
| Barker Alan | -- | American Secure Title | |
| Barker Alan | -- | American Secure Title | |
| Mark Higley Construction Lc | -- | Northern Title Company |
Source: Public Records
Mortgage History
| Date | Status | Borrower | Loan Amount |
|---|---|---|---|
| Open | Barker Alan | $140,800 | |
| Closed | Barker Alan | $145,600 |
Source: Public Records
Tax History Compared to Growth
Tax History
| Year | Tax Paid | Tax Assessment Tax Assessment Total Assessment is a certain percentage of the fair market value that is determined by local assessors to be the total taxable value of land and additions on the property. | Land | Improvement |
|---|---|---|---|---|
| 2024 | $2,415 | $550,117 | $155,000 | $395,117 |
| 2023 | $2,332 | $506,360 | $135,000 | $371,360 |
| 2022 | $2,498 | $506,360 | $135,000 | $371,360 |
| 2021 | $2,264 | $390,000 | $110,000 | $280,000 |
| 2020 | $1,727 | $267,700 | $75,000 | $192,700 |
| 2019 | $1,805 | $267,700 | $75,000 | $192,700 |
| 2018 | $1,870 | $253,170 | $50,000 | $203,170 |
| 2017 | $1,726 | $123,585 | $0 | $0 |
| 2016 | $1,790 | $104,170 | $0 | $0 |
| 2015 | $1,510 | $104,170 | $0 | $0 |
| 2014 | $1,365 | $104,170 | $0 | $0 |
| 2013 | -- | $101,865 | $0 | $0 |
Source: Public Records
Map
Nearby Homes