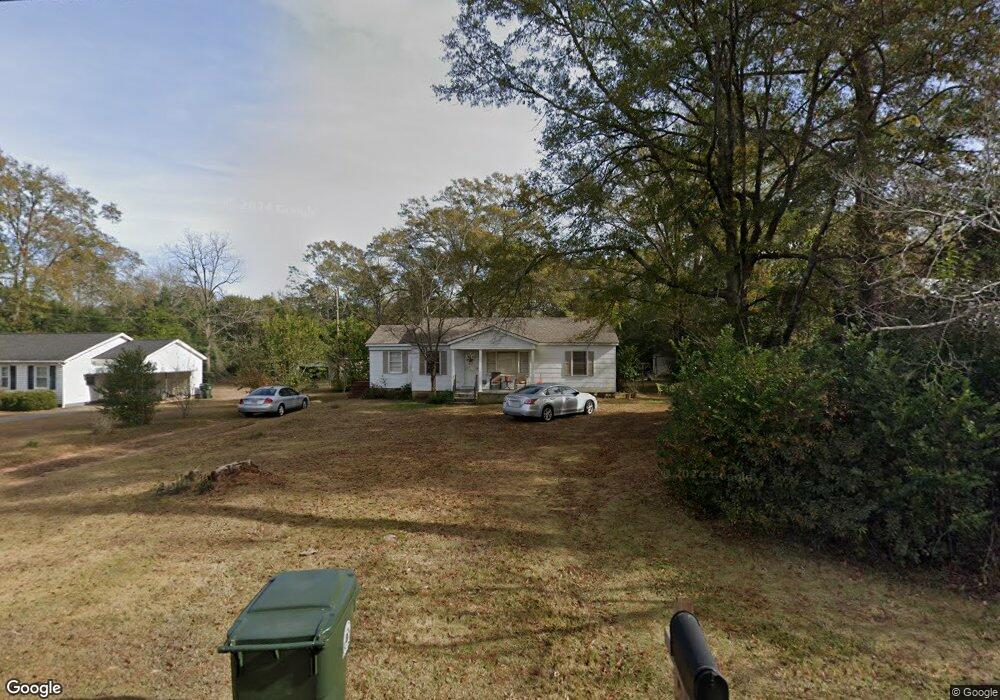
280 S Central Ave Blakely, GA 39823
Estimated Value: $69,552 - $117,000
Studio
1
Bath
1,262
Sq Ft
$77/Sq Ft
Est. Value
About This Home
This home is located at 280 S Central Ave, Blakely, GA 39823 and is currently estimated at $97,388, approximately $77 per square foot. 280 S Central Ave is a home located in Early County with nearby schools including Early County Elementary School, Early County Middle School, and Early County High School.
Ownership History
Date
Name
Owned For
Owner Type
Purchase Details
Closed on
Jul 17, 2020
Sold by
Hall Rhonda Gruber
Bought by
Clenney Rentals Inc
Current Estimated Value
Home Financials for this Owner
Home Financials are based on the most recent Mortgage that was taken out on this home.
Original Mortgage
$54,145
Interest Rate
3.1%
Mortgage Type
New Conventional
Purchase Details
Closed on
Dec 28, 2010
Sold by
Pataula Land & Title Company Llc
Bought by
Hall Rhonda Gruber
Purchase Details
Closed on
Feb 6, 2002
Sold by
Hall William Douglas
Bought by
Pataula Land & Title
Purchase Details
Closed on
Sep 22, 1998
Sold by
Gruber Mary Alice
Bought by
Hall William Douglas
Purchase Details
Closed on
Sep 21, 1998
Sold by
Gruber Wallace Geral
Bought by
Gruber Mary Alice
Purchase Details
Closed on
Apr 4, 1997
Sold by
Gruber Mary Alice
Bought by
Gruber Wallace Geral
Create a Home Valuation Report for This Property
The Home Valuation Report is an in-depth analysis detailing your home's value as well as a comparison with similar homes in the area
Home Values in the Area
Average Home Value in this Area
Purchase History
| Date | Buyer | Sale Price | Title Company |
|---|---|---|---|
| Clenney Rentals Inc | -- | -- | |
| Hall Rhonda Gruber | -- | -- | |
| Pataula Land & Title | -- | -- | |
| Hall William Douglas | -- | -- | |
| Gruber Mary Alice | -- | -- | |
| Gruber Wallace Geral | -- | -- | |
| Hall Wm | -- | -- |
Source: Public Records
Mortgage History
| Date | Status | Borrower | Loan Amount |
|---|---|---|---|
| Closed | Clenney Rentals Inc | $54,145 |
Source: Public Records
Tax History
| Year | Tax Paid | Tax Assessment Tax Assessment Total Assessment is a certain percentage of the fair market value that is determined by local assessors to be the total taxable value of land and additions on the property. | Land | Improvement |
|---|---|---|---|---|
| 2025 | $1,139 | $34,109 | $3,000 | $31,109 |
| 2024 | $769 | $24,912 | $3,000 | $21,912 |
| 2023 | $739 | $24,912 | $3,000 | $21,912 |
| 2022 | $629 | $24,956 | $3,000 | $21,956 |
| 2021 | $535 | $22,015 | $3,000 | $19,015 |
| 2020 | $550 | $22,015 | $3,000 | $19,015 |
| 2019 | $563 | $21,900 | $3,000 | $18,900 |
| 2018 | $656 | $21,900 | $3,000 | $18,900 |
| 2017 | $657 | $21,900 | $3,000 | $18,900 |
| 2016 | $606 | $20,270 | $3,000 | $17,270 |
| 2015 | -- | $20,358 | $3,000 | $17,358 |
| 2014 | -- | $20,358 | $3,000 | $17,358 |
| 2013 | -- | $20,673 | $3,000 | $17,673 |
Source: Public Records
Map
Nearby Homes
- 115 S Central Ave
- 182 Lakewood Dr
- 1827 Tarver Dr
- 0000 Martin Luther King Junior Blvd
- 451 Lakewood Dr
- 436 Lakewood Dr
- 507 Lakewood Dr
- 21 E Railroad Ln
- 0 Dasaree Ln Unit 10683861
- 337 College St
- 234 College St
- 76 S Jefferson Ave
- 73 Grove Place
- 829 Flowers Dr
- 187 Evergreen Ave
- 2019 S Main St
- 96 Jesse Johnson Dr
- 8 Lots Unknown Ln
- 00 Garden Dr
- 556 Flowers Dr
- 260 S Central Ave
- 300 S Central Ave
- 232 S Central Ave
- 269 S Central Ave
- 287 S Central Ave
- 1319 N Main St
- 1287 N Main St
- 253 S Central Ave
- 305 S Central Ave
- 218 Woodlawn Dr
- 233 S Central Ave
- 1263 N Main St
- 188 Woodlawn Dr
- 1363 N Main St
- 206 S Central Ave
- 217 S Central Ave
- 325 S Central Ave
- 150 Woodlawn Dr
- 1231 N Main St
- 197 S Central Ave
Your Personal Tour Guide
Ask me questions while you tour the home.