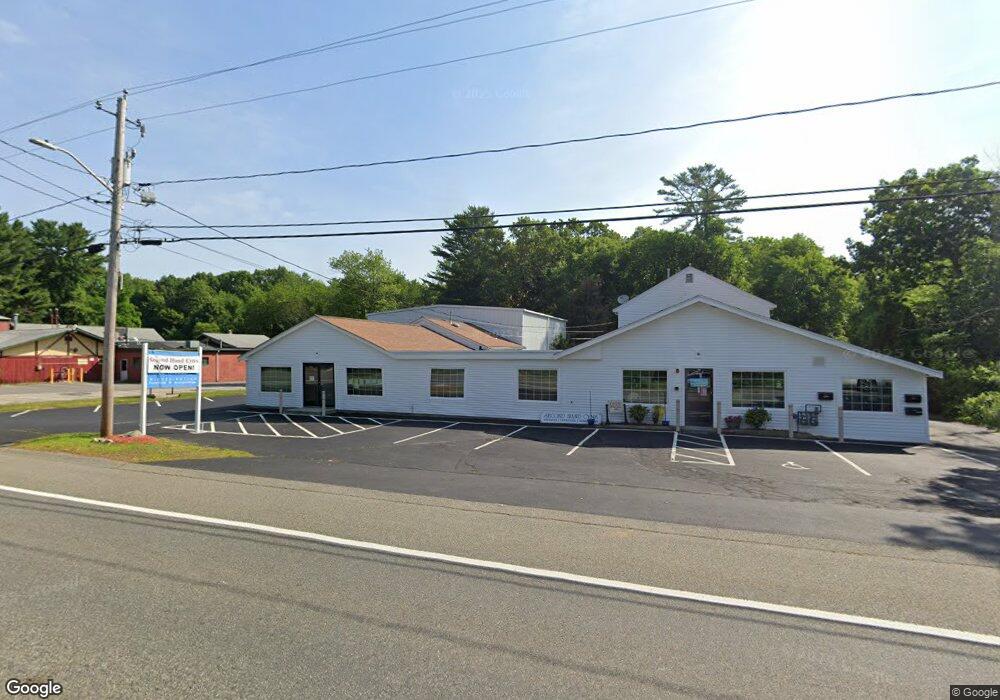
280 S Main St West Bridgewater, MA 02379
2
Beds
1
Bath
7,570
Sq Ft
1.24
Acres
About This Home
This home is located at 280 S Main St, West Bridgewater, MA 02379. 280 S Main St is a home located in Plymouth County with nearby schools including Spring Street Elementary School, Howard Elementary School, and Rose L. MacDonald Elementary School.
Ownership History
Date
Name
Owned For
Owner Type
Purchase Details
Closed on
Oct 17, 2013
Sold by
Bridgewater Savings Ba
Bought by
280 S Main Street Rt and Eng
Purchase Details
Closed on
Aug 14, 2013
Sold by
Wolfe Realty Llp
Bought by
Bridgewater Savings Ba
Purchase Details
Closed on
Jan 17, 2001
Sold by
Easton Wrw Rt and Weatherby Winfield R
Bought by
Weatherbys Wicker
Purchase Details
Closed on
Feb 2, 1998
Sold by
Cacchione Alexander and Cacchione Sharon L
Bought by
Easton Wrmw Rt and Weatherby Winfield R
Create a Home Valuation Report for This Property
The Home Valuation Report is an in-depth analysis detailing your home's value as well as a comparison with similar homes in the area
Home Values in the Area
Average Home Value in this Area
Purchase History
| Date | Buyer | Sale Price | Title Company |
|---|---|---|---|
| 280 S Main Street Rt | $370,000 | -- | |
| 280 S Main Street Rt | $370,000 | -- | |
| Bridgewater Savings Ba | $606,033 | -- | |
| Bridgewater Savings Ba | $606,033 | -- | |
| Weatherbys Wicker | $550,000 | -- | |
| Weatherbys Wicker | $550,000 | -- | |
| Easton Wrmw Rt | $20,000 | -- | |
| Easton Wrmw Rt | $20,000 | -- |
Source: Public Records
Mortgage History
| Date | Status | Borrower | Loan Amount |
|---|---|---|---|
| Previous Owner | Easton Wrmw Rt | $700,000 | |
| Previous Owner | Easton Wrmw Rt | $40,000 |
Source: Public Records
Tax History Compared to Growth
Tax History
| Year | Tax Paid | Tax Assessment Tax Assessment Total Assessment is a certain percentage of the fair market value that is determined by local assessors to be the total taxable value of land and additions on the property. | Land | Improvement |
|---|---|---|---|---|
| 2025 | -- | $756,700 | $301,700 | $455,000 |
| 2024 | -- | $735,700 | $290,800 | $444,900 |
| 2023 | $0 | $679,100 | $247,300 | $431,800 |
| 2022 | $0 | $653,300 | $247,300 | $406,000 |
| 2021 | $0 | $653,300 | $247,300 | $406,000 |
| 2020 | $0 | $653,300 | $247,300 | $406,000 |
| 2019 | $0 | $653,300 | $247,300 | $406,000 |
| 2018 | $16,022 | $658,500 | $256,800 | $401,700 |
| 2017 | -- | $611,400 | $233,500 | $377,900 |
| 2016 | -- | $676,600 | $221,800 | $454,800 |
| 2015 | -- | $602,300 | $210,100 | $392,200 |
| 2014 | -- | $602,300 | $210,100 | $392,200 |
Source: Public Records
Map
Nearby Homes
- 192 S Main St
- 30 Keenan St
- 92 Bryant St
- 603 East St
- 34 Captain Carlson Way
- 484-486 Main St
- 86 Wall St
- 6 Andrea Way
- 18 Aldrich Rd
- 116 Center St
- 4 Mullen Way
- 10 Duck Farm Ln
- 60 Miranda Way
- 29 Ellis Ave
- 10 Charles St
- 245-r Laurel St
- 248 Center St Unit 7
- 10 College Rd
- 180 Main St Unit A15
- 180 Main St Unit A5