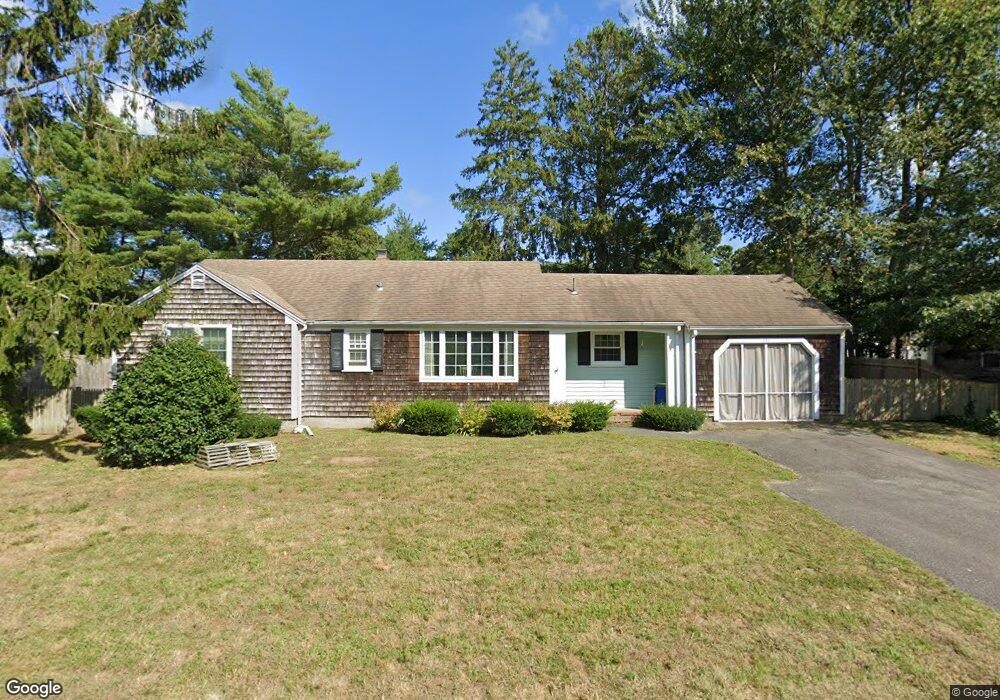
280 Trotting Park Rd West Dennis, MA 02670
West Dennis NeighborhoodEstimated Value: $460,000 - $650,000
2
Beds
1
Bath
1,200
Sq Ft
$490/Sq Ft
Est. Value
About This Home
This home is located at 280 Trotting Park Rd, West Dennis, MA 02670 and is currently estimated at $587,428, approximately $489 per square foot. 280 Trotting Park Rd is a home located in Barnstable County with nearby schools including Dennis-Yarmouth Regional High School and St. Pius X. School.
Ownership History
Date
Name
Owned For
Owner Type
Purchase Details
Closed on
Sep 24, 2020
Sold by
Campbell Andrea
Bought by
Campbell Andrea and Lowe-Campbell Joseph
Current Estimated Value
Home Financials for this Owner
Home Financials are based on the most recent Mortgage that was taken out on this home.
Original Mortgage
$124,000
Outstanding Balance
$109,584
Interest Rate
2.8%
Mortgage Type
New Conventional
Estimated Equity
$477,844
Purchase Details
Closed on
Aug 14, 1996
Sold by
Reavy Robert L and Reavy Carol A
Bought by
Campbell Emma J
Purchase Details
Closed on
Jul 11, 1989
Sold by
Peterson Ruth M
Bought by
Reavyl Robert L
Home Financials for this Owner
Home Financials are based on the most recent Mortgage that was taken out on this home.
Original Mortgage
$85,000
Interest Rate
10.38%
Mortgage Type
Purchase Money Mortgage
Create a Home Valuation Report for This Property
The Home Valuation Report is an in-depth analysis detailing your home's value as well as a comparison with similar homes in the area
Home Values in the Area
Average Home Value in this Area
Purchase History
| Date | Buyer | Sale Price | Title Company |
|---|---|---|---|
| Campbell Andrea | -- | None Available | |
| Campbell Emma J | $101,000 | -- | |
| Campbell Emma J | $101,000 | -- | |
| Reavyl Robert L | $115,000 | -- |
Source: Public Records
Mortgage History
| Date | Status | Borrower | Loan Amount |
|---|---|---|---|
| Open | Campbell Andrea | $124,000 | |
| Previous Owner | Reavyl Robert L | $85,000 |
Source: Public Records
Tax History Compared to Growth
Tax History
| Year | Tax Paid | Tax Assessment Tax Assessment Total Assessment is a certain percentage of the fair market value that is determined by local assessors to be the total taxable value of land and additions on the property. | Land | Improvement |
|---|---|---|---|---|
| 2025 | $2,578 | $595,400 | $218,500 | $376,900 |
| 2024 | $2,478 | $564,400 | $210,100 | $354,300 |
| 2023 | $2,396 | $513,100 | $191,000 | $322,100 |
| 2022 | $2,178 | $388,900 | $149,100 | $239,800 |
| 2021 | $9,733 | $347,200 | $146,200 | $201,000 |
| 2020 | $9,636 | $339,800 | $157,500 | $182,300 |
| 2019 | $2,105 | $341,200 | $165,400 | $175,800 |
| 2018 | $8,664 | $304,700 | $147,000 | $157,700 |
| 2017 | $1,843 | $299,600 | $147,000 | $152,600 |
| 2016 | $1,836 | $281,100 | $152,200 | $128,900 |
| 2015 | $1,799 | $281,100 | $152,200 | $128,900 |
| 2014 | $1,785 | $281,100 | $152,200 | $128,900 |
Source: Public Records
Map
Nearby Homes
- 15 Woodside Park Rd
- 12 Spoonbill Rd
- 26 Center St
- 3 Pinefield Ln
- 61 Trotters Ln
- 95 Center St
- 71 Main St
- 80 Michaels Ave
- 19 Standish Way
- 467 Main St
- 4 Coffey Ln
- 125 Main St Unit 3
- 401 Main St Unit 201
- 401 Main St Unit 101
- 22 Wixon Rd
- 31 Easy St
- 72 Bassett Ln
- 268 Main St
- 23 Doric Ave
- 37 Ocean Dr Unit 2
- 15 Woodside Park
- 284 Trotting Park Rd
- 274 Trotting Park Rd
- 9 Woodside Park
- 21 Woodside Park
- 21 Woodside Park Rd
- 281 Trotting Park Rd
- 285 Trotting Park Rd
- 275 Trotting Park Rd
- 20 Woodside Park
- 24 Woodside Park Rd
- 24 Woodside Park
- 16 Woodside Park Rd
- 16 Woodside Park
- 268 Trotting Park Rd
- 36 Woodside Park Rd
- 36 Woodside Park
- 12 Woodside Park
- 269 Trotting Park Rd
- 12 Woodside Park Rd