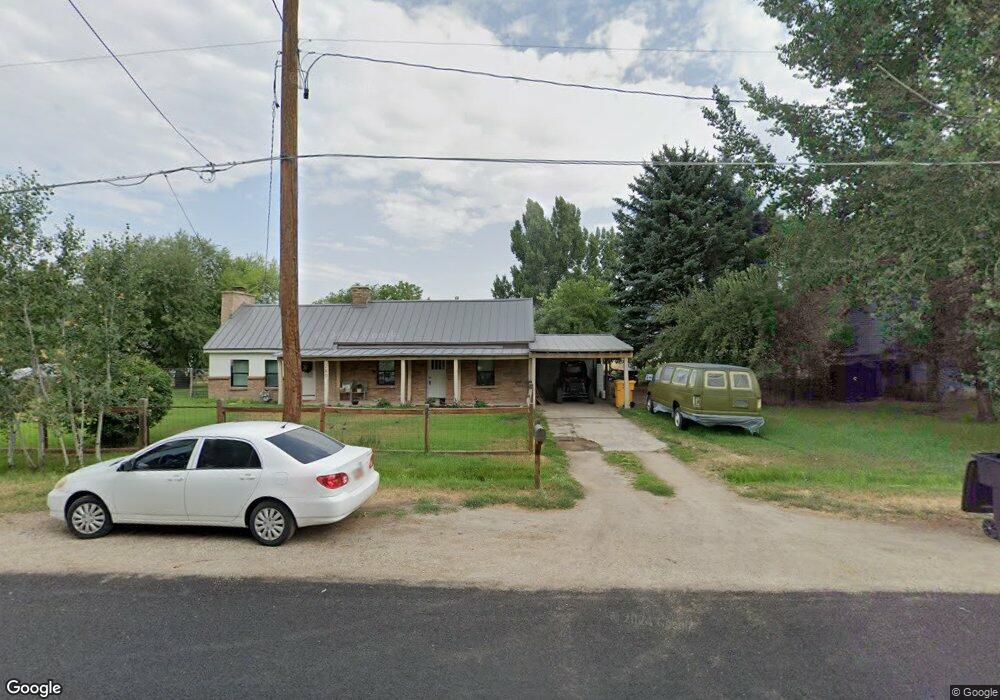
280 W 400 N Heber City, UT 84032
Estimated Value: $490,000 - $533,546
2
Beds
2
Baths
1,224
Sq Ft
$421/Sq Ft
Est. Value
About This Home
This home is located at 280 W 400 N, Heber City, UT 84032 and is currently estimated at $515,387, approximately $421 per square foot. 280 W 400 N is a home located in Wasatch County with nearby schools including Heber Valley Elementary School, Rocky Mountain Middle School, and Wasatch High School.
Ownership History
Date
Name
Owned For
Owner Type
Purchase Details
Closed on
Mar 25, 2022
Sold by
Johnson Elizabeth B
Bought by
Gillespie Laura
Current Estimated Value
Purchase Details
Closed on
Oct 24, 2017
Sold by
Johnson Elizabeth
Bought by
Johnson Elizabeth B
Home Financials for this Owner
Home Financials are based on the most recent Mortgage that was taken out on this home.
Original Mortgage
$142,000
Interest Rate
3.25%
Mortgage Type
Adjustable Rate Mortgage/ARM
Purchase Details
Closed on
Jul 3, 2013
Sold by
Johnson Jonathan
Bought by
Johnson Jonathan and Johnson Elizabeth
Home Financials for this Owner
Home Financials are based on the most recent Mortgage that was taken out on this home.
Original Mortgage
$128,500
Interest Rate
3.57%
Mortgage Type
New Conventional
Create a Home Valuation Report for This Property
The Home Valuation Report is an in-depth analysis detailing your home's value as well as a comparison with similar homes in the area
Home Values in the Area
Average Home Value in this Area
Purchase History
| Date | Buyer | Sale Price | Title Company |
|---|---|---|---|
| Gillespie Laura | -- | Prospect Land Title | |
| Johnson Elizabeth B | -- | Titleone | |
| Johnson Elizabeth | -- | Title One | |
| Johnson Jonathan | -- | Surety Title |
Source: Public Records
Mortgage History
| Date | Status | Borrower | Loan Amount |
|---|---|---|---|
| Previous Owner | Johnson Elizabeth | $142,000 | |
| Previous Owner | Johnson Jonathan | $128,500 |
Source: Public Records
Tax History Compared to Growth
Tax History
| Year | Tax Paid | Tax Assessment Tax Assessment Total Assessment is a certain percentage of the fair market value that is determined by local assessors to be the total taxable value of land and additions on the property. | Land | Improvement |
|---|---|---|---|---|
| 2025 | $2,390 | $386,520 | $240,000 | $146,520 |
| 2024 | $2,390 | $435,360 | $240,000 | $195,360 |
| 2023 | $2,390 | $360,008 | $125,000 | $235,008 |
| 2022 | $2,003 | $360,008 | $125,000 | $235,008 |
| 2021 | $2,145 | $306,191 | $114,000 | $192,191 |
| 2020 | $2,071 | $287,874 | $125,000 | $162,874 |
| 2019 | $1,792 | $144,581 | $0 | $0 |
| 2018 | $1,334 | $107,650 | $0 | $0 |
| 2017 | $1,193 | $95,731 | $0 | $0 |
| 2016 | $1,065 | $83,231 | $0 | $0 |
| 2015 | $1,016 | $83,231 | $0 | $0 |
| 2014 | $865 | $70,292 | $0 | $0 |
Source: Public Records
Map
Nearby Homes