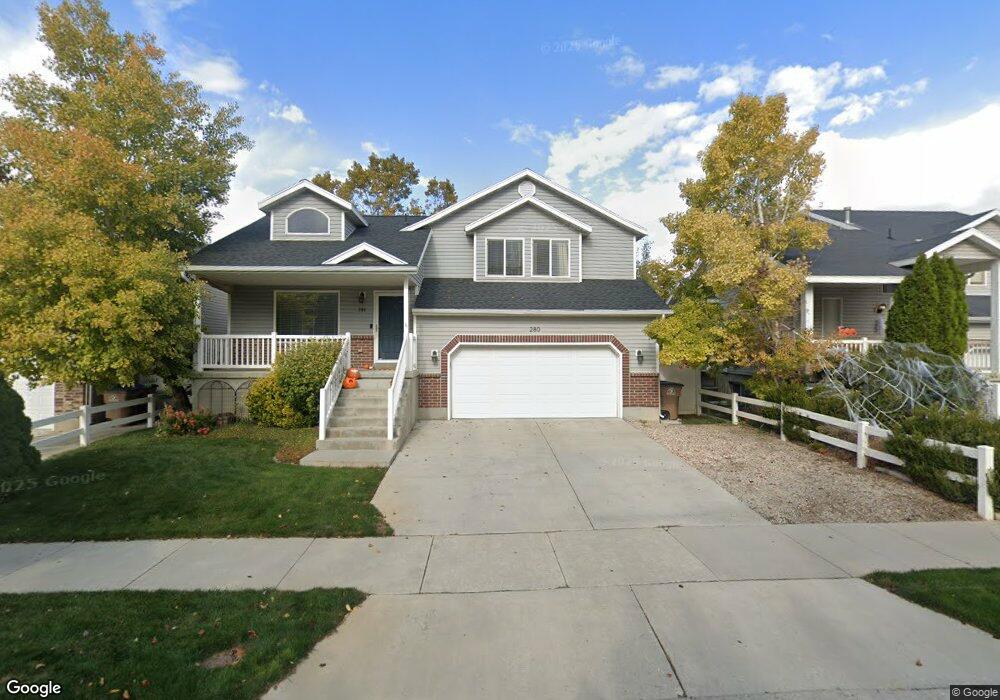
280 W Bricker Rd Draper, UT 84020
Estimated Value: $581,000 - $622,578
4
Beds
4
Baths
2,268
Sq Ft
$268/Sq Ft
Est. Value
About This Home
This home is located at 280 W Bricker Rd, Draper, UT 84020 and is currently estimated at $608,395, approximately $268 per square foot. 280 W Bricker Rd is a home located in Salt Lake County with nearby schools including Draper Park Middle School, Channing Hall, and American Preparatory Academy - Draper 2 Campus.
Ownership History
Date
Name
Owned For
Owner Type
Purchase Details
Closed on
Sep 23, 2022
Sold by
Bradford Smith Robert
Bought by
Cannon Seth and Cannon Johanna
Current Estimated Value
Home Financials for this Owner
Home Financials are based on the most recent Mortgage that was taken out on this home.
Original Mortgage
$498,000
Outstanding Balance
$476,902
Interest Rate
5.55%
Mortgage Type
New Conventional
Estimated Equity
$131,493
Purchase Details
Closed on
Feb 25, 2005
Sold by
Trade West Development Inc
Bought by
Smith Robert Bradford and Smith Kim R
Home Financials for this Owner
Home Financials are based on the most recent Mortgage that was taken out on this home.
Original Mortgage
$191,790
Interest Rate
5.73%
Mortgage Type
FHA
Purchase Details
Closed on
Jun 26, 2003
Sold by
Shea Development Inc
Bought by
Trade West Development Inc
Create a Home Valuation Report for This Property
The Home Valuation Report is an in-depth analysis detailing your home's value as well as a comparison with similar homes in the area
Home Values in the Area
Average Home Value in this Area
Purchase History
| Date | Buyer | Sale Price | Title Company |
|---|---|---|---|
| Cannon Seth | -- | Truly Title | |
| Smith Robert Bradford | -- | Integrated Title Ins Svcs | |
| Trade West Development Inc | -- | Meridian Title |
Source: Public Records
Mortgage History
| Date | Status | Borrower | Loan Amount |
|---|---|---|---|
| Open | Cannon Seth | $498,000 | |
| Previous Owner | Smith Robert Bradford | $191,790 |
Source: Public Records
Tax History
| Year | Tax Paid | Tax Assessment Tax Assessment Total Assessment is a certain percentage of the fair market value that is determined by local assessors to be the total taxable value of land and additions on the property. | Land | Improvement |
|---|---|---|---|---|
| 2025 | -- | $584,200 | $154,100 | $430,100 |
| 2024 | -- | $555,600 | $142,600 | $413,000 |
| 2023 | $2,820 | $539,900 | $135,600 | $404,300 |
| 2022 | $2,820 | $516,500 | $132,900 | $383,600 |
| 2021 | $2,419 | $378,400 | $104,800 | $273,600 |
| 2020 | $2,289 | $339,500 | $104,800 | $234,700 |
| 2019 | $2,183 | $316,400 | $99,000 | $217,400 |
| 2018 | $1,984 | $293,900 | $99,000 | $194,900 |
| 2017 | $1,960 | $278,100 | $99,000 | $179,100 |
| 2016 | $1,923 | $265,100 | $99,000 | $166,100 |
| 2015 | $1,812 | $231,400 | $101,000 | $130,400 |
| 2014 | $1,708 | $213,000 | $93,100 | $119,900 |
Source: Public Records
Map
Nearby Homes
- 264 W 13165 S
- 246 W Golden Harvest Rd
- 52 Golden Privet Dr
- 587 W Cephus Rd
- 74 E Golden Privet Dr
- 13469 S Mule Creek Cove
- 13545 S Villa Rosa Way
- 13554 Bella Monte Dr Unit 113
- 13176 Day Ct
- 265 E 13275 S
- 722 W Webb Rd
- 13160 S 300 E
- 13208 Sunset Glen Way
- 13202 S Sunset Glen Way
- 261 E Concord Farm Ln Unit 6
- 12235 S Ryder Ct
- 296 E Ireland Ln Unit 101
- 329 Brown Farm Ln
- 1043 W 13200 S
- 248 E 13800 S Unit 27
- 280 Bricker Rd
- 282 Bricker Rd
- 276 W Bricker Rd
- 282 W Bricker Rd
- 276 Bricker Rd
- 301 W 13165 S
- 274 Bricker Rd
- 274 W Bricker Rd
- 297 W 13165 S
- 307 W 13165 S
- 300 Bricker Dr
- 320 Bricker Rd
- 286 W Bricker Rd
- 13177 S 330 W
- 291 W 13165 S
- 303 Bricker Dr
- 303 Bricker Rd
- 272 W Bricker Rd
- 272 Bricker Rd
- 313 W 13165 S
Your Personal Tour Guide
Ask me questions while you tour the home.